Coworking Industry SEO Data Analysis
Discover what the top coworking spaces are doing to drive tours and acquire more members
With over 2,700 keywords and location combinations analyzed across 54,000 pages, dive deep into understanding what and how coworking spaces across America leverage SEO to grow.
Download: Coworking Industry SEO Data Analysis
Tired of not being sure what actually moves the needle for coworking spaces when it comes to SEO? Want to finally understand what top providers like WeWork and Regus are doing on Google? Well, we’ve put together a study analyzing 54,000 pages across 2,700 keywords and locations to answer those questions and more.
This guide includes:
- How the top coworking providers like WeWork and Regus are leveraging Google
- Immediate next steps to help you drive more tours and acquire more members by using SEO
- Data-driven insights on how you can leapfrog ahead of your local and national competition
Coworking Industry SEO Data Analysis
Introduction
While working with numerous coworking spaces across North America for the past several years, the same questions kept coming up over and over again: Should I do SEO? Do backlinks matter? How do I compete with X when I only have Y budget? What does it take to rank in my city?
In this industry wide study, I hope to help answer some of these questions to give you data-backed answers that you can quickly act on.
Throughout this study, I’ve gathered over 54,000 pages across 2,700 keywords and locations across the United States. Half of these keywords are coworking related (e.g. coworking space near me) and the other half being private office (e.g. private office space for rent) related. This split was done in order to better understand the competitive landscape across both product types as intent and results vary greatly between them.
With these results in hand, I analyzed these pages across multiple data points including quantity and quality of business reviews, page speed, word count, and backlinks.
What was initially started as a way to demystify fact from fiction has become one of the most comprehensive studies in the coworking industry when it comes to SEO and the investment involved with it.
Terminology
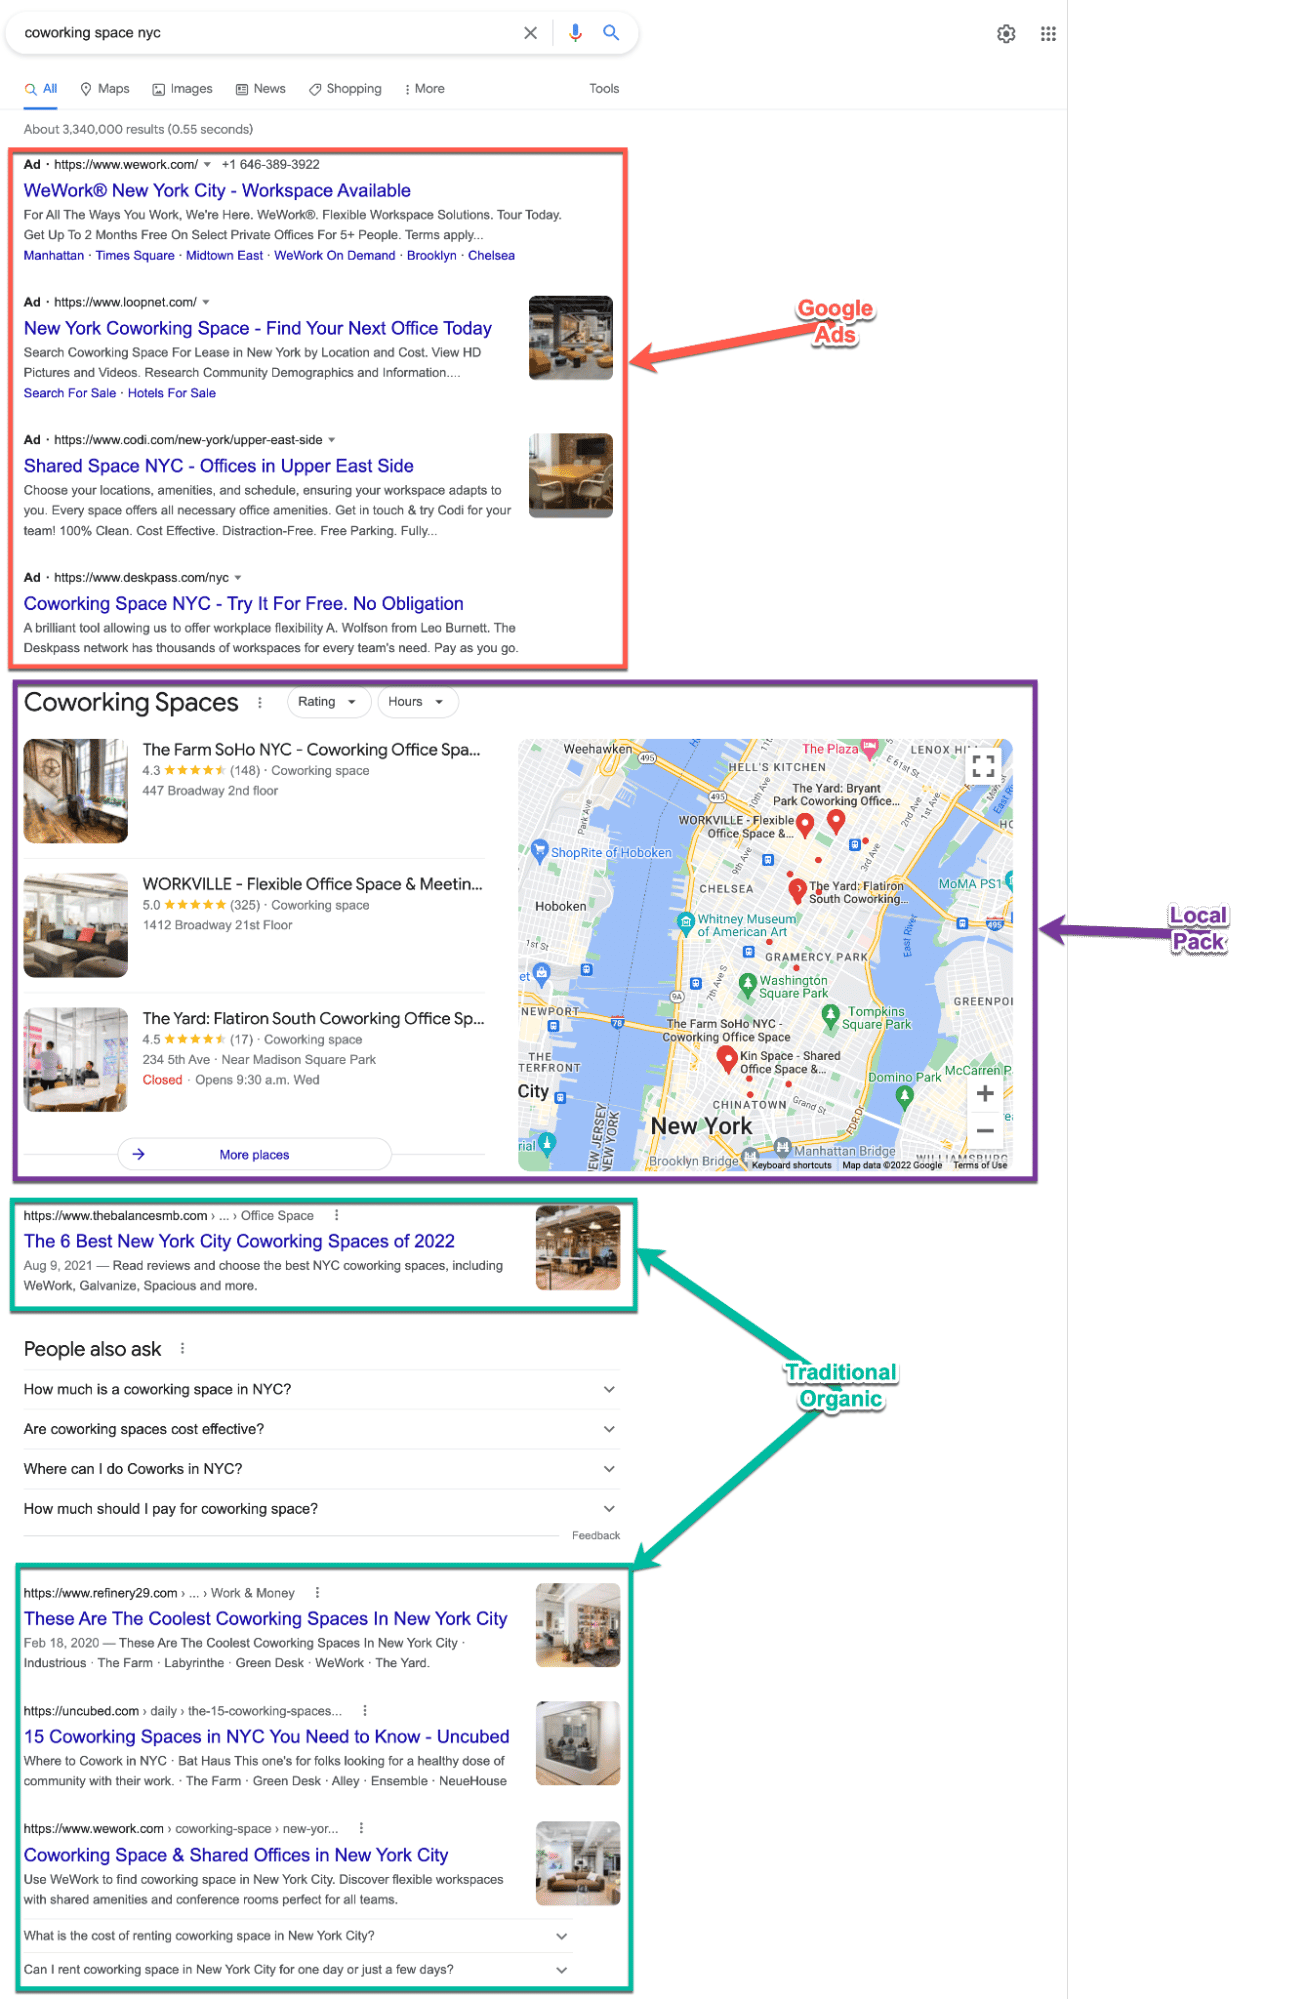
The first step before diving into the insights from this study is to understand what a SERP is and what appears on it.
SERP stands for Search Engine Results Page which as you would expect is the page that you see once you search for something on Google. Each SERP can have a variety of different elements based on the keyword that you searched.
For this analysis, I looked at the local pack which is outlined in purple in the above screenshot. The local pack is shown whenever a keyword with local purchase intent is used, meaning that they are looking to buy from a nearby vendor. The local pack and Google Map results are both powered by your Google Business Profile (formerly Google My Business Profile) or GBP for short.
I also analyzed the traditional organic results which are outlined in green in the above screenshot. These results are the normal 10 links that appear on the first page of all Google Search results.
It is important to not only understand the distinction between the local pack and traditional organic results but also that Google uses two different algorithms to determine which Google Business Profiles and websites to show in each section.
As a coworking space, it is critical to optimize for both the local pack and traditional organic results to drive ongoing and sustainable growth through SEO.
Findings
Local Map Pack (Google Business Profile)
Reviews
|
🗝️Key Takeaways
|
One of the biggest marketing levers that you can pull as a coworking space is reviews on your space’s Google Business Profile. Not only do reviews act as a ranking factor across Google Search and Google Maps, they also play a major role in the purchasing journey of a potential member.
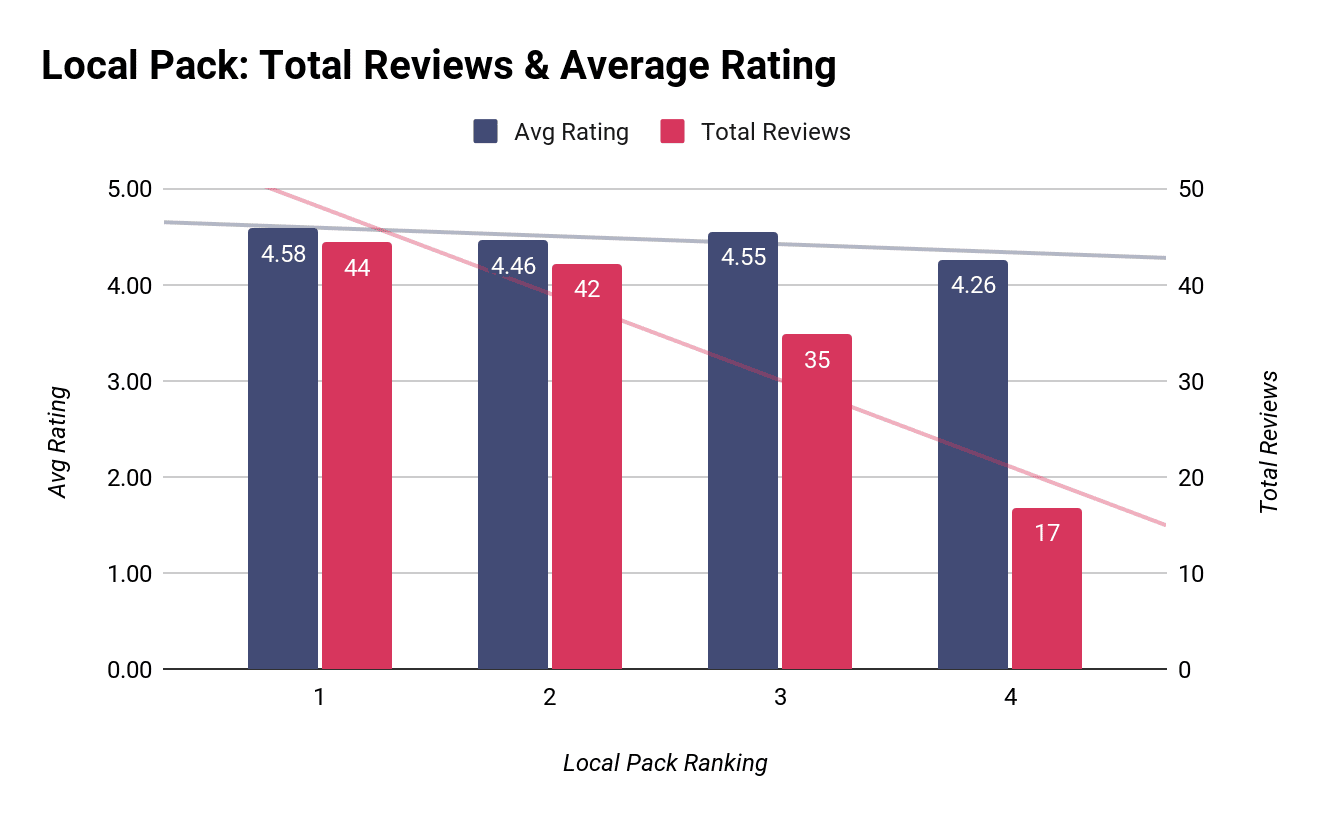
In our study, I found that not only were the total number of ratings important but, so was the average rating.
As seen in the above chart, there is a tight correlation between how a coworking space ranks in the local pack and the total amount of reviews and average rating that they’ve earned. With the top ranked coworking spaces having an average 4.58 rating and an average of 44 reviews with a sharp drop in total reviews as rankings decrease. This correlation shows that if you want to rank in the local pack, not only do you need a good average review, but you need a lot of reviews contributing to that average.
What this means for you is that if you’re dragging your feet or ignoring getting reviews altogether, you are missing out on a major opportunity to drive new members and build a stronger reputation.
An interesting secondary finding from this is that none of the coworking spaces, regardless of rank, size, or location, have a perfect 5 average rating. This coincides with a study done by PowerReviews and Northwestern University which found that some negative reviews actually help strengthen the overall trustworthiness of positive reviews and that 4.2 to 4.5 stars is actually the ideal rating rather than a perfect 5. So if you do have a few negative reviews, there is no need to panic.
Place Topics
|
🗝️Key Takeaways
|
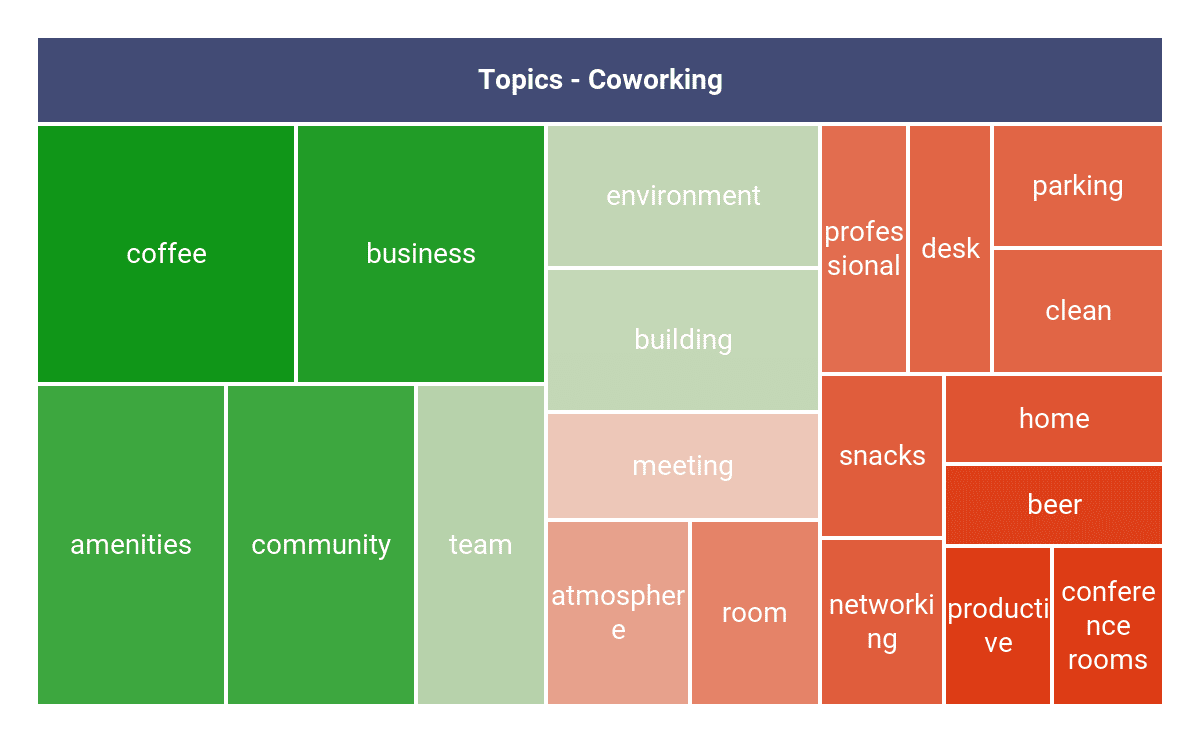
Place topics is a relatively new feature within Google Business Profile and provides searchers with common themes about your coworking space. These topics and their relevance are extracted from reviews on the space’s Google Business Profile that are commonly mentioned.
Two important things to note about place topics is that they only appear when your GBP has enough reviews and are automatically generated. What that unfortunately means is that you have no control over what is highlighted.
With that being said, let’s dive into what some common place topics are for coworking and private office related keywords:
Coworking Keywords
|
Topics |
Frequency |
Relevancy |
|
coffee |
277 |
5.14 |
|
business |
266 |
6.52 |
|
amenities |
249 |
6.64 |
|
community |
247 |
7.91 |
|
team |
169 |
6.21 |
|
environment |
162 |
5.40 |
|
building |
160 |
8.18 |
|
meeting |
122 |
5.16 |
|
atmosphere |
108 |
5.69 |
|
room |
97 |
6.53 |
|
professional |
89 |
5.34 |
|
desk |
86 |
7.33 |
|
parking |
86 |
6.26 |
|
clean |
86 |
5.63 |
|
snacks |
83 |
9.18 |
|
networking |
83 |
5.58 |
|
home |
80 |
5.55 |
|
beer |
73 |
4.68 |
|
productive |
70 |
6.06 |
|
conference rooms |
70 |
8.01 |
The above table shows both the frequency and relevancy (on a scale of 0-10) of the most popular topics for GBPs that are ranking the local pack.
Amenities is a common theme that is throughout many of the topics. This can be seen with “amenities” being explicitly mentioned along with “coffee,” “parking,” “snacks," and “beer.” All of these topics have both a high frequency across all of the coworking GBP results and high average relevancy.
Another common theme that is recurring is the overall atmosphere of the space. This can be seen in topics such as “atmosphere” being explicitly listed along with “community,” “environment,” “atmosphere,” “professional,” and “productive” being highlighted as well.
Private Office Keywords
|
Topics |
Frequency |
Relevancy |
|
business |
1025 |
7.53 |
|
building |
624 |
6.86 |
|
team |
579 |
7.60 |
|
amenities |
538 |
6.28 |
|
coffee |
466 |
5.19 |
|
environment |
395 |
5.98 |
|
community |
356 |
7.31 |
|
company |
301 |
6.51 |
|
clean |
258 |
6.41 |
|
meeting |
253 |
5.13 |
|
atmosphere |
248 |
6.01 |
|
management |
242 |
5.12 |
|
conference rooms |
239 |
6.98 |
|
professional |
198 |
7.53 |
|
room |
191 |
5.83 |
|
price |
169 |
4.58 |
|
parking |
167 |
5.75 |
|
productive |
144 |
5.99 |
|
manager |
142 |
4.37 |
|
beer |
127 |
4.15 |
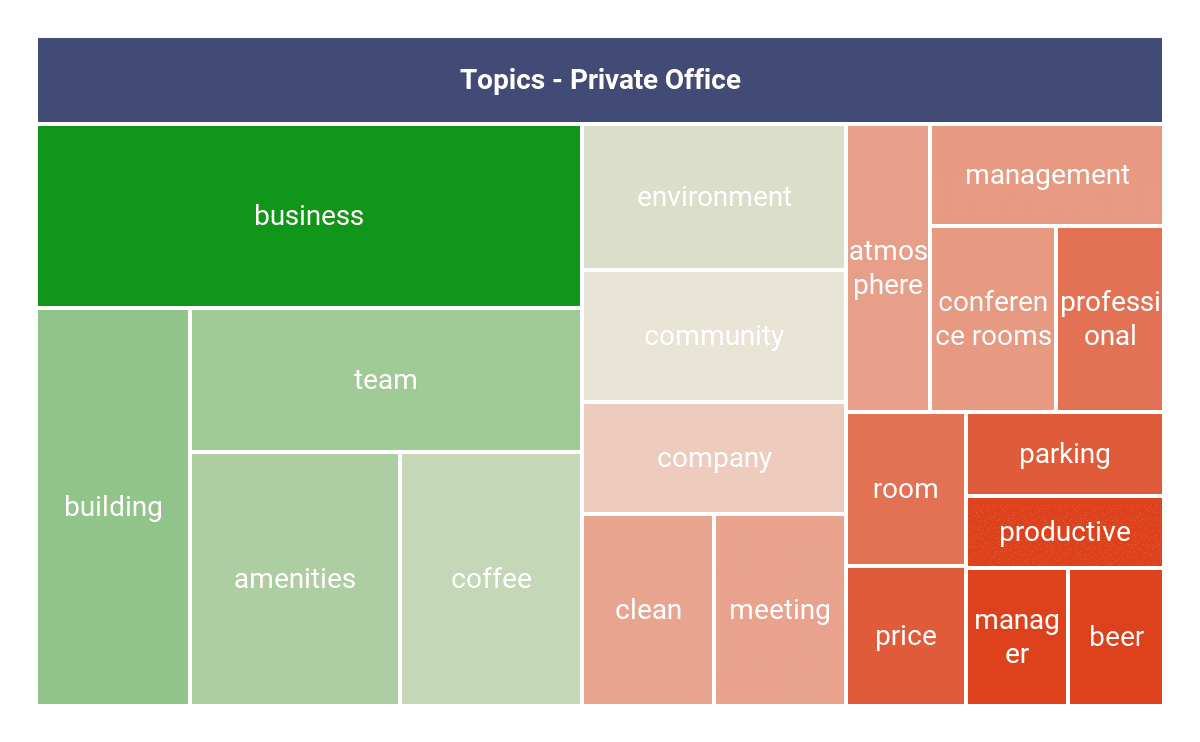
As shown above on the private office side, the same themes found in the coworking keywords can be seen again, where amenity based topics are recurring with “amenities,”“coffee,” “beer,” and “parking” being mentioned frequently.
On the atmosphere side, similar topics are also frequently mentioned including “environment,” “atmosphere,” “professional,” and “productive.”
The biggest change between the top GBP place topics between coworking and private office topics is the shift towards more corporate terms such as “manager”, “company”, and “professional”. For example, in the private office topics “business” is most frequently mentioned at 1025 while with coworking keywords it is second and mentioned only 266 along with lower relevancy of 6.52 versus 7.53 for private offices. This can also be seen in other topics like "manager,” “company,” and “management.”
Categories
An extremely easy way of telling both Google and potential members that you’re a coworking space is through your Google Business Profile’s primary and secondary categories. Each profile can have a single primary category and up to 9 secondary, or additional, categories.
These categories are critical in helping Google understand that you are a coworking space and determine which keywords you should be appearing for in search and map results.
In order to gain a more meaningful understanding of primary and secondary categories, I split our analysis into coworking and private office keyword buckets.
Primary Categories
|
🗝️Key Takeaways
|
Since your space’s GBP can only have a single primary category it is important to select a category that matches your product offering but also aligns with your business goals.
For example, are you as a space more focused on your traditional coworking products or on private offices? That answer can help shed some light on which primary category to choose for your GBP.
Coworking Keywords
With coworking focused keywords, an overwhelming majority of 93.56% of the top GBP’s use coworking space as their primary category. This is no surprise though, as it just makes logical sense for coworking Google Business Profiles to take advantage of the coworking spaces category, meaning they rank for those keywords.
|
Category |
Total Count |
% of Total |
|
Coworking space |
1060 |
93.56% |
|
Office space rental agency |
57 |
5.03% |
|
Virtual office rental |
5 |
0.44% |
|
Business to business service |
4 |
0.35% |
|
Business center |
3 |
0.26% |
|
Corporate office |
3 |
0.26% |
|
Event venue |
1 |
0.09% |
Private Office Keywords
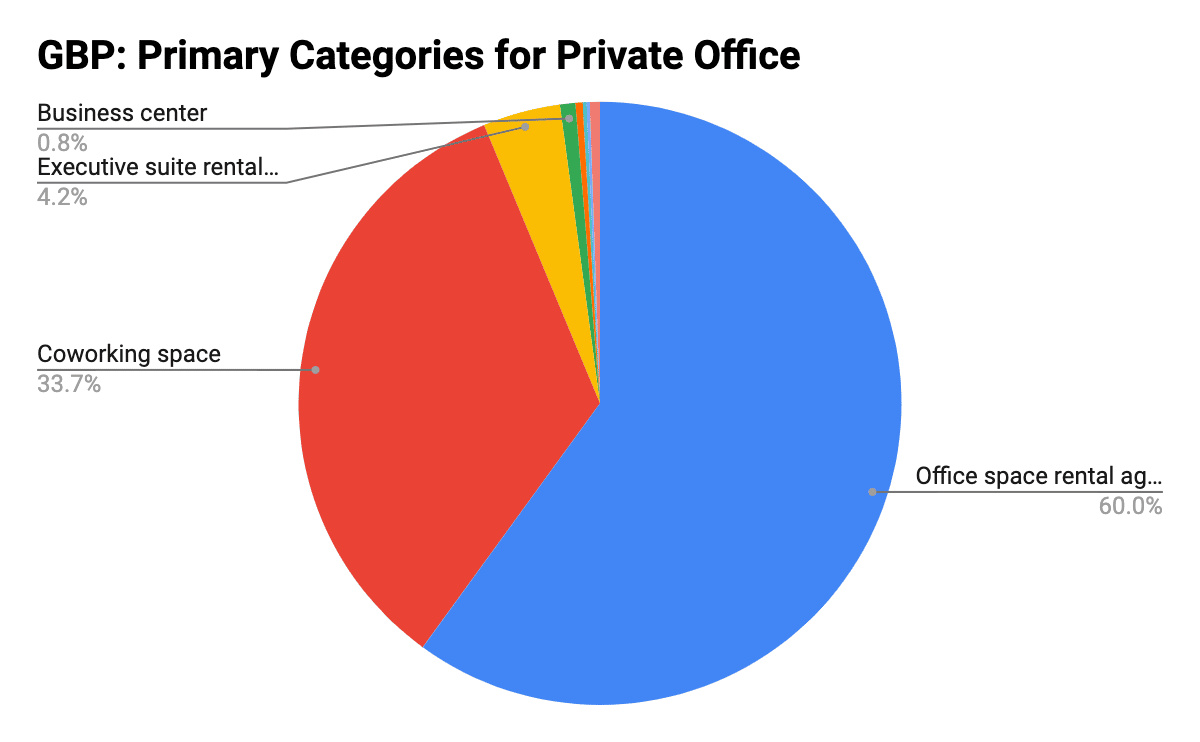
Private office based keywords on the other hand tell a different story. There isn’t an individual category that dominates all others. Instead there are two main categories: office space rental agency at 60% and coworking space at 34%.
|
Category |
Total Count |
% of Total |
|
Office space rental agency |
1748 |
60.01% |
|
Coworking space |
982 |
33.71% |
|
Executive suite rental agency |
121 |
4.15% |
|
Business center |
24 |
0.82% |
|
Virtual office rental |
11 |
0.38% |
|
Corporate office |
6 |
0.21% |
|
Consultant |
5 |
0.17% |
|
Other |
16 |
0.55% |
This shows us a few important points:
The first is that Google semantically understands that coworking spaces as a type of business provides private office space. This can be seen in the 33.7% of local pack results using coworking space as a primary category when appearing for private office related queries.
Secondly, Google understands that it’s not just coworking spaces that provide private office space, but other types of businesses as well. This not only forces you as a coworking space into an important decision of which primary category to use but also indicates an increase in competition for private office space.
Another interesting finding is the 3rd most used primary category, which is “executive suite rental agency,”which takes up a very small percentage (4.15%) compared to “office space rental agency” and “coworking space” categories. Intuitively you would expect that just by the name it would represent a larger percentage since the “office space rental agency” category represents 60% of private office space local pack results.
Secondary Categories
|
🗝️Key Takeaways
|
As mentioned previously, each Google Business Profile can contain up to 9 secondary categories which are used to help Google further understand which services your coworking space provides and which keywords you should be appearing for in search and Google Maps.
Though secondary categories don’t carry as much weight as compared to your primary category, they should not be ignored and should be used to their fullest extent.
Coworking Keywords
|
Secondary Category |
Total Count |
% of Total |
|
Office space rental agency |
551 |
29.11% |
|
Event venue |
292 |
15.43% |
|
Virtual office rental |
158 |
8.35% |
|
Executive suite rental agency |
123 |
6.50% |
|
Business center |
121 |
6.39% |
|
Conference center |
115 |
6.08% |
|
Business to business service |
86 |
4.54% |
|
Coworking space |
73 |
3.86% |
|
Mailbox rental service |
63 |
3.33% |
|
Corporate office |
42 |
2.22% |
|
Other |
269 |
14.21% |
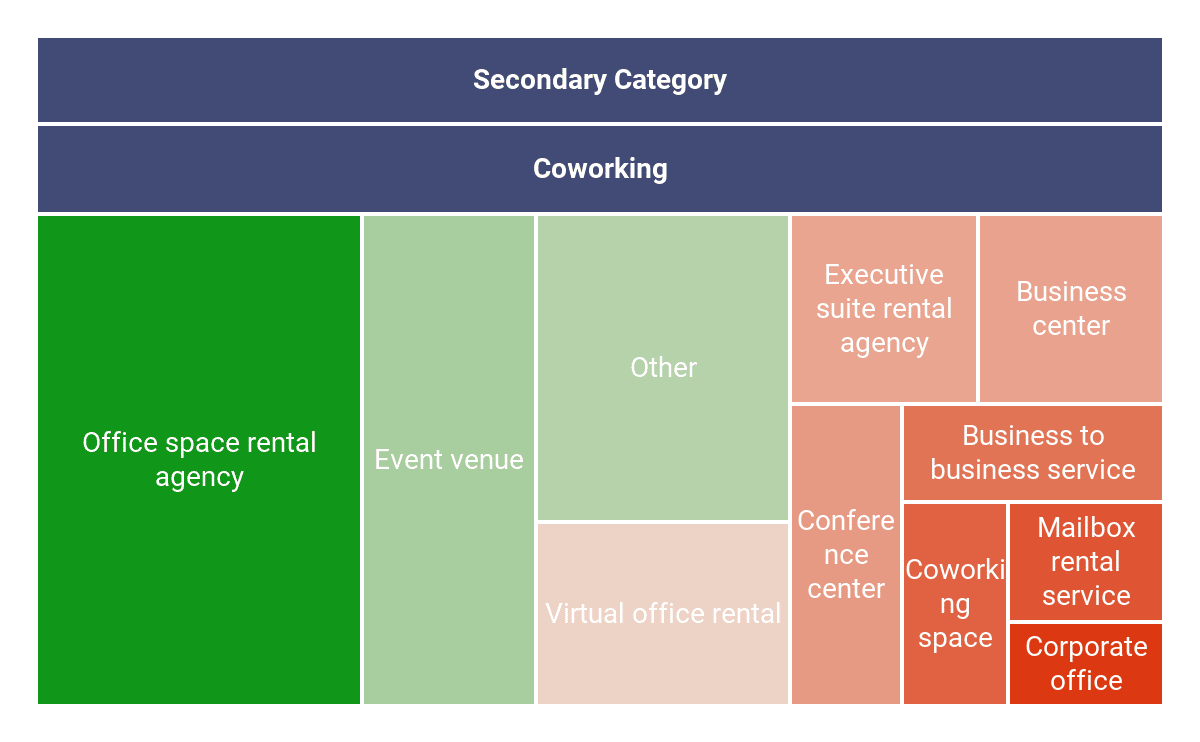
Since “coworking space” was the definitive majority at 93.56% as a primary category, it is no surprise that the most used secondary category within the local pack for coworking keywords is “office space rental agency” at 29%. It is then followed by “event venue” at 14.43% and then a sharp decline to 8.35% for “virtual office rental” as a secondary category.
The large distribution of secondary categories also gives us directional insight into the fact that the coworking spaces ranking in the local pack offer a diverse range of secondary services that they provide. This includes event and conference/meeting spaces, virtual offices, telephone answering and some even having recording studios or cafes.
So if you’re a coworking space looking to get the most out of your GBP’s secondary categories, use as many of the 9 category slots as possible that are relevant to your space’s product offering.
Private Office Keywords
|
Secondary Category |
Total Count |
% of Total |
|
Virtual office rental |
1570 |
16.37% |
|
Coworking space |
1330 |
13.87% |
|
Business center |
1038 |
10.82% |
|
Executive suite rental agency |
941 |
9.81% |
|
Office space rental agency |
879 |
9.17% |
|
Conference center |
691 |
7.21% |
|
Telephone answering service |
560 |
5.84% |
|
Mailbox rental service |
459 |
4.79% |
|
Event venue |
419 |
4.37% |
|
Business to business service |
267 |
2.78% |
|
Other |
1436 |
14.97% |
Similar to the coworking space keywords, the private office local pack results has a diverse range of secondary categories, with the top secondary category, “virtual office rental,” making up only 16.37% of the total results and “coworking space” following closely at 13.87%.
Again, the diversity and distribution of secondary categories gives us a hint at who you’re competing against on the private office front. It shows us that you’re not primarily competing against coworking spaces but rather more formal office rental type companies (e.g. Regus), which we will explore later in the competitor section. The diverse competition is further seen in the remaining top secondary categories that are more focused on traditional corporate services such as conference center, business center, executive suite rentals, and mailbox rental services.
Primary URLs
|
🗝️Key Takeaways
|
Within your Google Business Profile, you have the ability to add a link to your coworking space’s website. This link acts as the first experience a potential member has on your website. Depending on whether you’re a single or multi-unit space will dictate where this link goes.
If you only have a single location then it should be going to your home page. On the other hand, if you have multiple locations, the link should go to the specific location’s page.
Below you can find an analysis broken down by coworking and private office keywords to better understand where the local pack links are going.
Coworking Keywords
|
Rank |
Location Page |
Home Page |
|
1 |
183 |
191 |
|
2 |
197 |
177 |
|
3 |
176 |
198 |
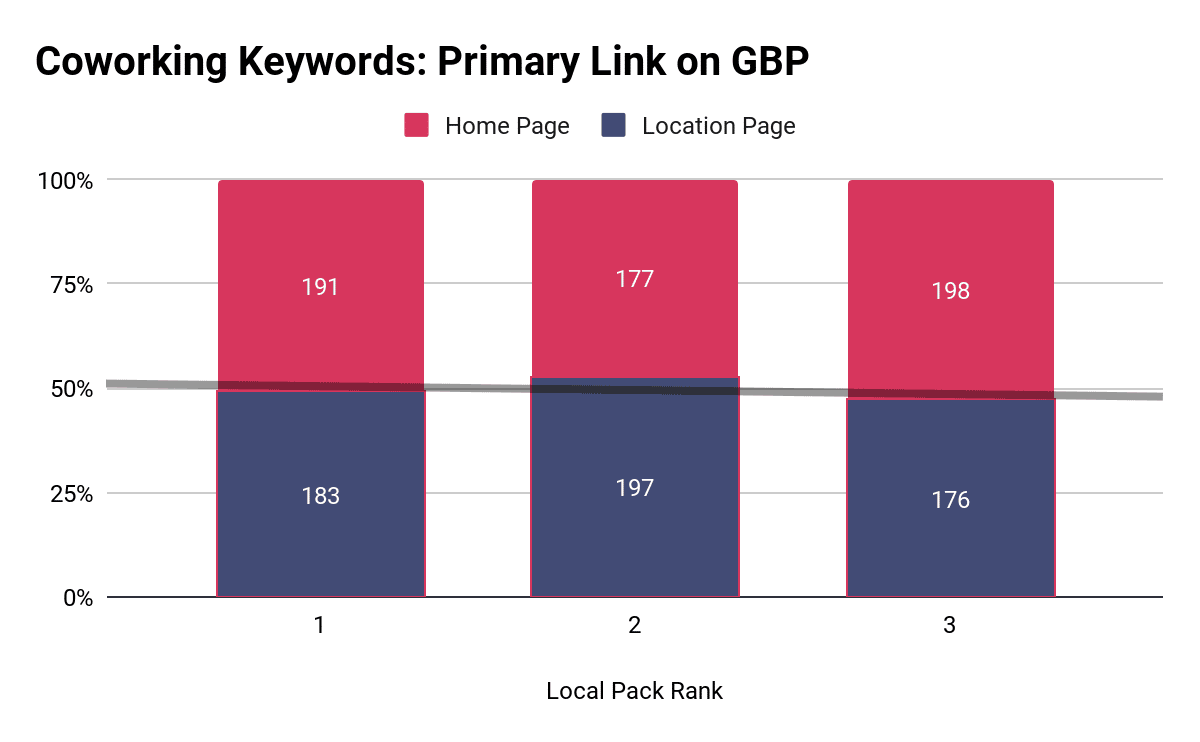
As shown in the above chart and graph, the primary links in the local pack results for coworking related keywords are relatively evenly distributed between homepages and non-homepages.
What this means is that neither single or multi-location coworking spaces have a leg up when it comes to which link to use in the local pack.
Private Office Keywords
|
Rank |
Location Page |
Home Page |
|
1 |
677 |
287 |
|
2 |
650 |
314 |
|
3 |
596 |
368 |
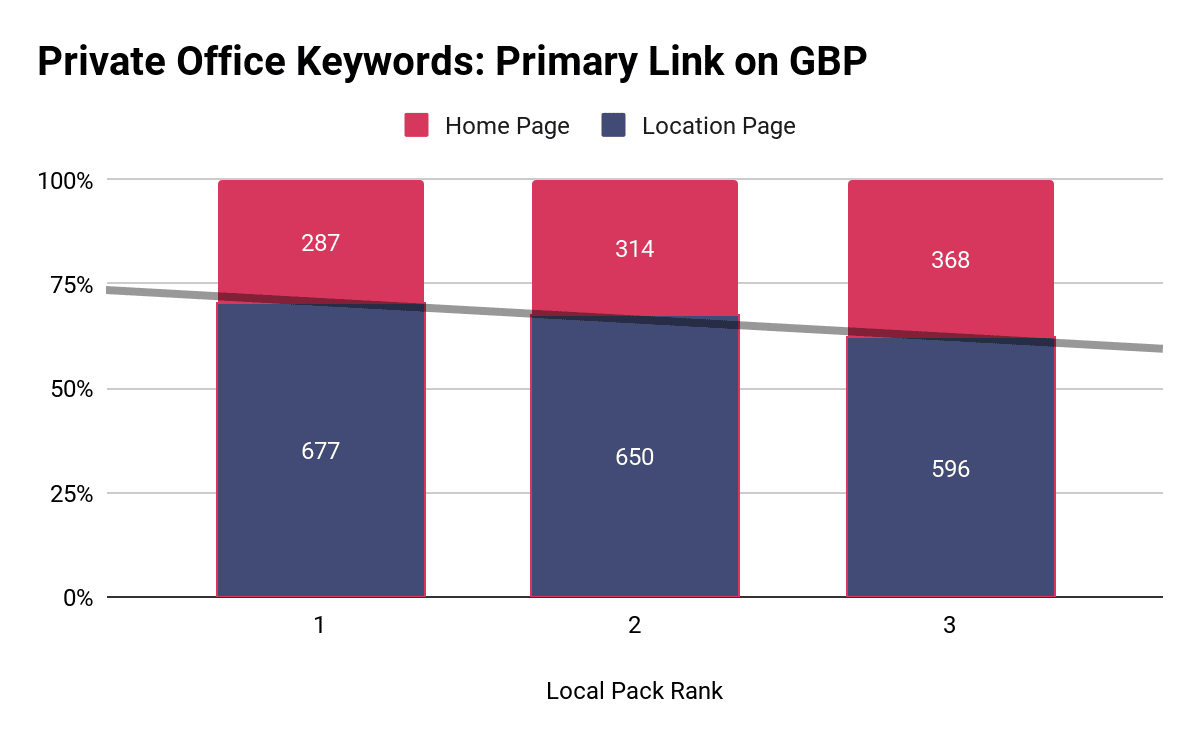
The private office local pack results tell a different story for the GBP primary link. In this case, location pages dominate the first position accounting for 70.23% of all results and then slowly decreasing down to 66.39% in the third position.
This tells us an important story which is that private office related local pack results are dominated by multi-location spaces, which suggests they are investing more heavily into their Google Business Profile strategy compared to single location spaces. To that point, single location spaces can still compete, but they need to make a cognizant effort in investing into building and maintaining their GBP presence.
Top Competitors
|
🗝️Key Takeaways
|
Now on to a topic that I am sure you’ve been waiting to learn more about: who the top competitors are and what they are doing.
As alluded to in previous sections, the competition looks different across coworking and private office local packs for this reason I’ll analyze the two separately.
Coworking Space GBP Competitors
|
Competitor |
Frequency |
Avg Rank |
|
WeWork |
195 |
1.90 |
|
Expansive |
50 |
1.94 |
|
Industrious Office |
33 |
2.36 |
|
Pipeline Workspaces |
19 |
1.00 |
|
Regus |
17 |
2.59 |
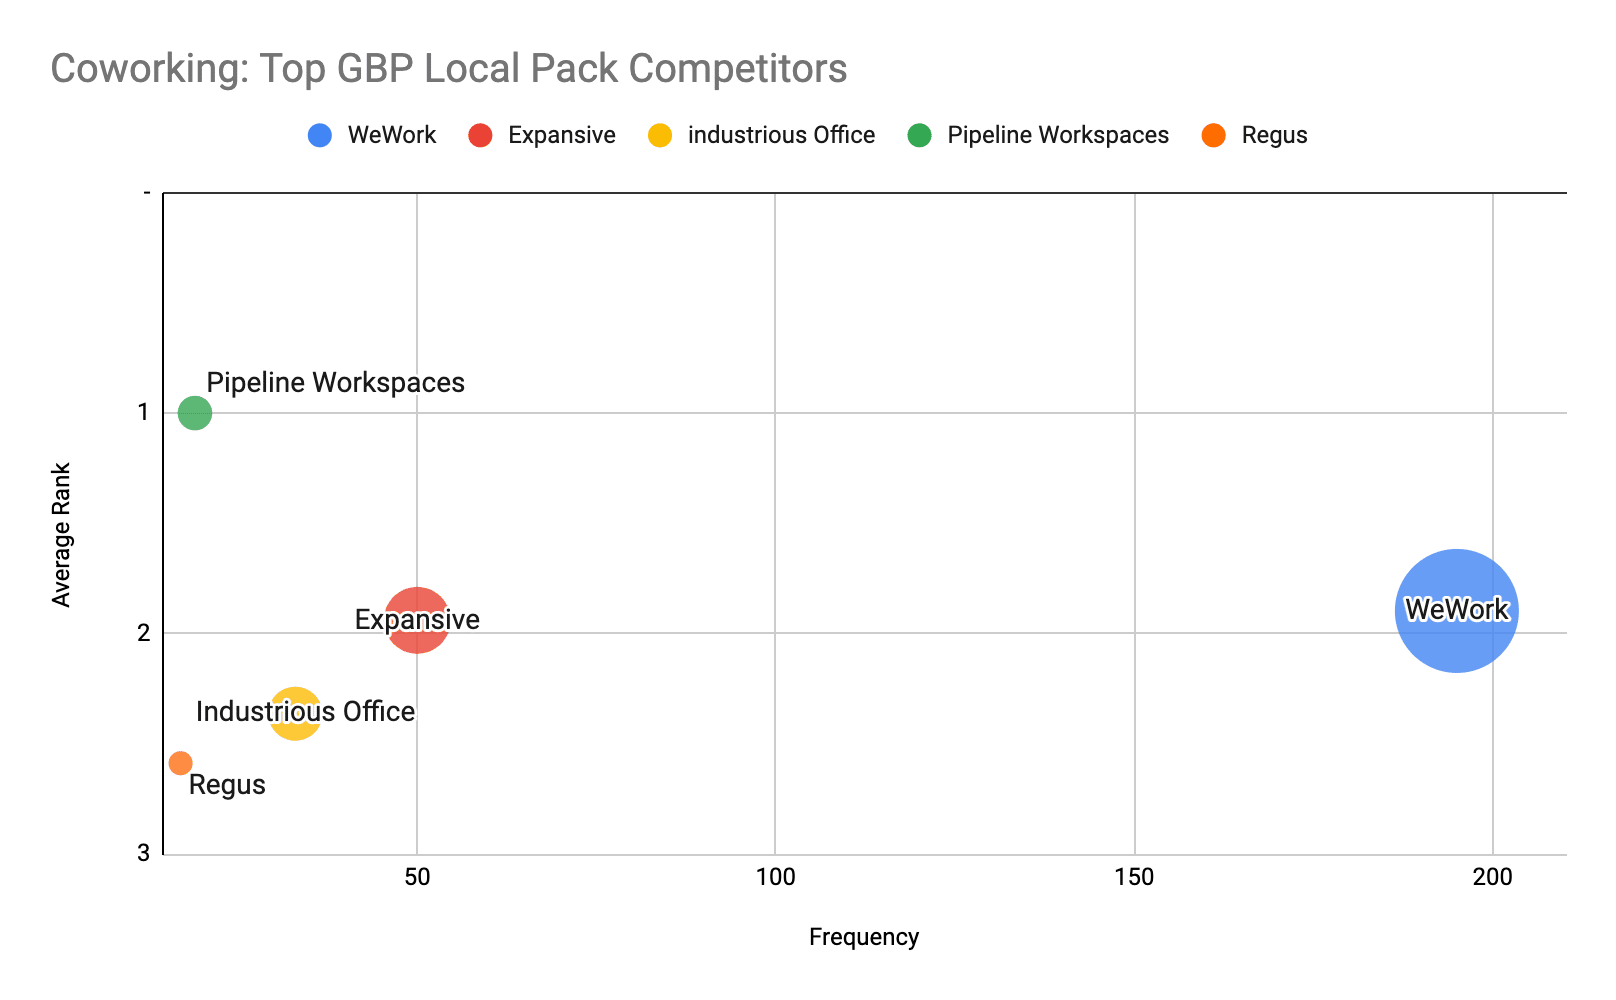
To no surprise to anyone in the coworking space business, WeWork stands head and shoulders above all other competitors when it comes to the frequency at which they appear across all coworking local packs. Appearing a total of 195 times with an impressive 1.90 average rank within the local map pack. Expansive, another multi-location coworking space, is the second most visible competitor appearing 50 times with a 1.94 average rank, while Industrious Office trails in third, appearing only 33 times and a lower total average rank of 2.36.
It is clear to see that WeWork is the competitor to beat, appearing 3 times more than any other competitor for coworking spaces keywords in the local pack.
Reviews
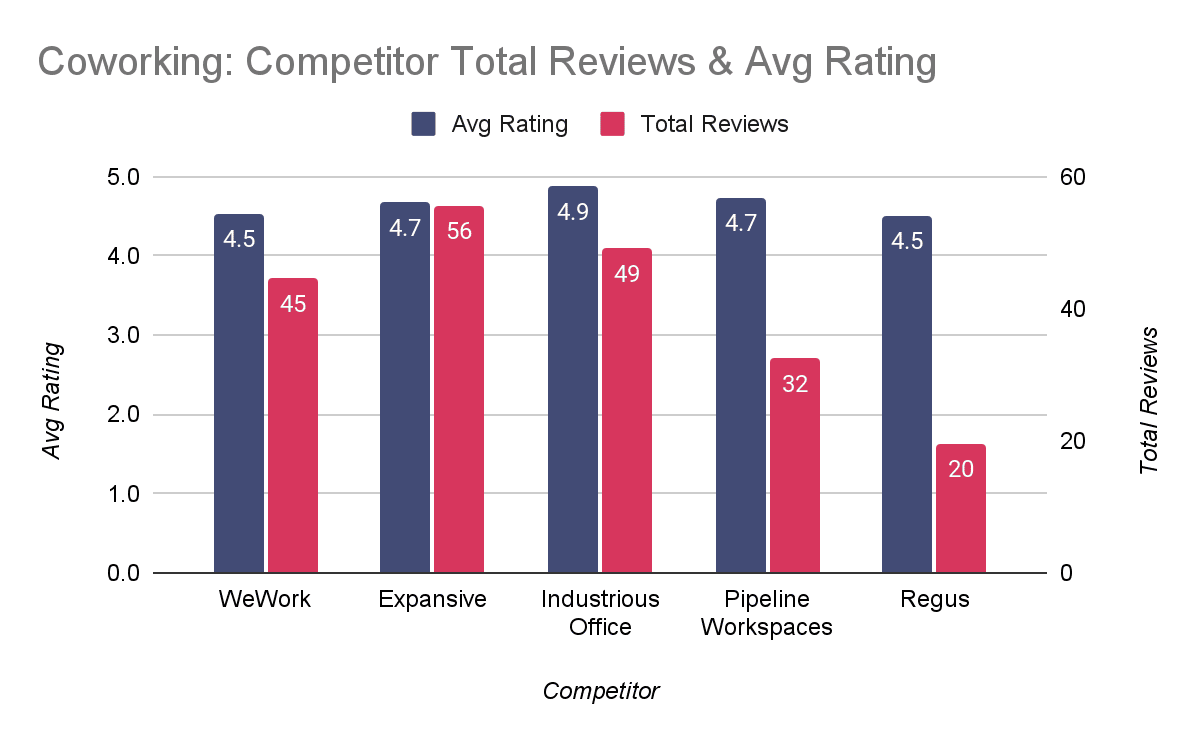
As shown in the above chart, the top 5 competitors on average have a higher average rating of 4.7 compared to the total average of 4.58. In terms of quantity, WeWork, Expansive and Industrious Office all have an above average total number of reviews averaging 50 compared to the industry average of 44, while Pipeline Workspaces and Regus are below the industry average of 44.
Place Topics
|
Topics |
Frequency |
Relevancy |
|
amenities |
105 |
6.50 |
|
team |
83 |
6.77 |
|
business |
81 |
7.05 |
|
building |
71 |
9.56 |
|
community |
51 |
5.18 |
|
environment |
51 |
5.88 |
|
beer |
51 |
5.08 |
|
clean |
43 |
6.05 |
|
meeting |
39 |
4.90 |
|
professional |
38 |
5.53 |
The most frequently mentioned topics across the top competitors coincide with the previously mentioned industry wide topics, with both the amenities and atmosphere being the common themes across the top competitors in the local pack. This further solidifies the fact that, as a coworking space, the amenities and the atmosphere of your space is a key factor in winning over new members.
Primary Categories
On the category side, it is yet again not a surprise that all competitors, except for Regus, are using “coworking space” as a primary category, while Regus is using “office rental space agency” as their primary category.
Secondary Categories
|
Competitor |
Office space rental agency |
Coworking space |
Virtual office rental |
Business center |
Event venue |
Executive suite rental agency |
|
WeWork |
193 |
2 |
0 |
0 |
0 |
0 |
|
Expansive |
50 |
0 |
0 |
0 |
0 |
2 |
|
Industrious Office |
0 |
0 |
0 |
0 |
0 |
0 |
|
Pipeline Workspaces |
7 |
0 |
7 |
0 |
7 |
0 |
|
Regus |
0 |
17 |
17 |
17 |
0 |
0 |
When evaluating secondary categories, office space rental agency is the most used category amongst the top competitors for coworking keywords, which is a similar finding when looking at the industry as a whole. Office space rental is closely followed by “coworking space” and “virtual office rental.”
The biggest takeaway from this is that the top competitors are not using all 9 secondary categories that are available to them. This is a major opportunity that is being missed and that competitors can take advantage of.
Office Space GBP Competitors
|
Competitor |
Frequency |
Avg Rank |
|
Regus |
401 |
2.06 |
|
WeWork |
164 |
2.16 |
|
Office Evolution |
138 |
1.80 |
|
Expansive |
126 |
1.58 |
|
Spaces |
104 |
2.31 |
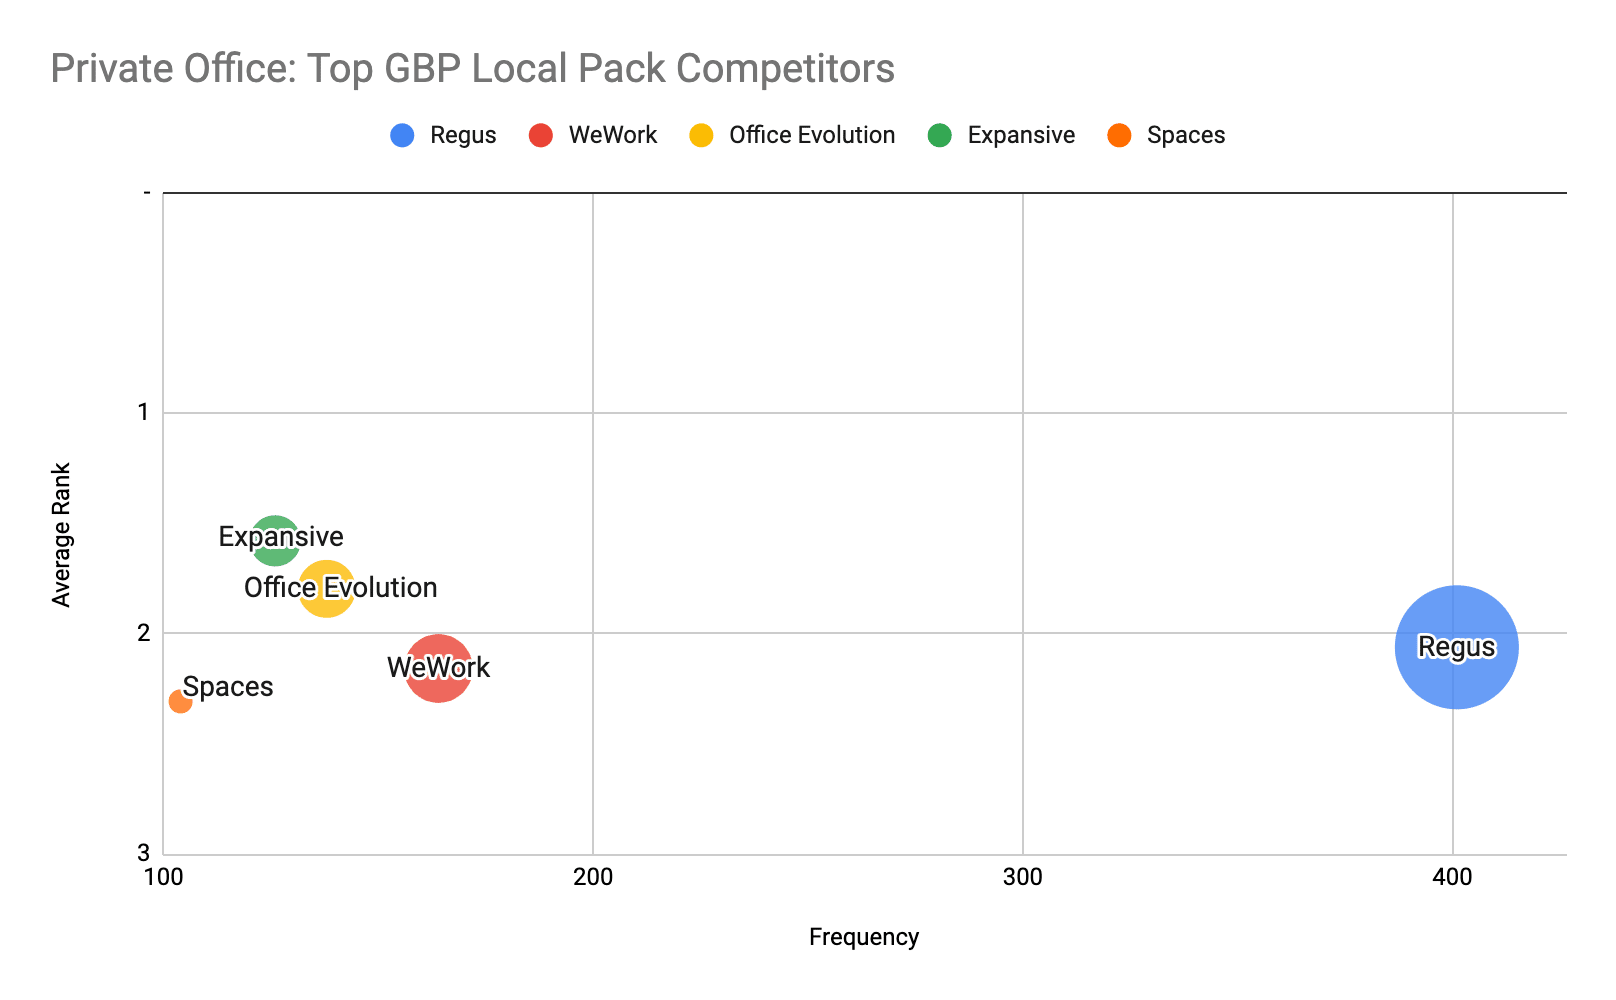
Flipping over to the top private office competitors, it is no surprise that Regus is the most visible competitor appearing just over 400 times within the local map pack at an average rank of 2.06. This coincides with them having hundreds of locations throughout the US and multiple offices within a single metropolitan area.
WeWork and Office Evolution follow as the second and third most visible competitors appearing only 164 and 138 times with an average rank of 2.16 and 1.80.
Reviews
|
Competitor |
Avg Rating |
Total Reviews |
|
Regus |
4.18 |
22 |
|
WeWork |
4.50 |
66 |
|
Office Evolution |
4.87 |
37 |
|
Expansive |
4.67 |
55 |
|
Spaces |
3.96 |
24 |
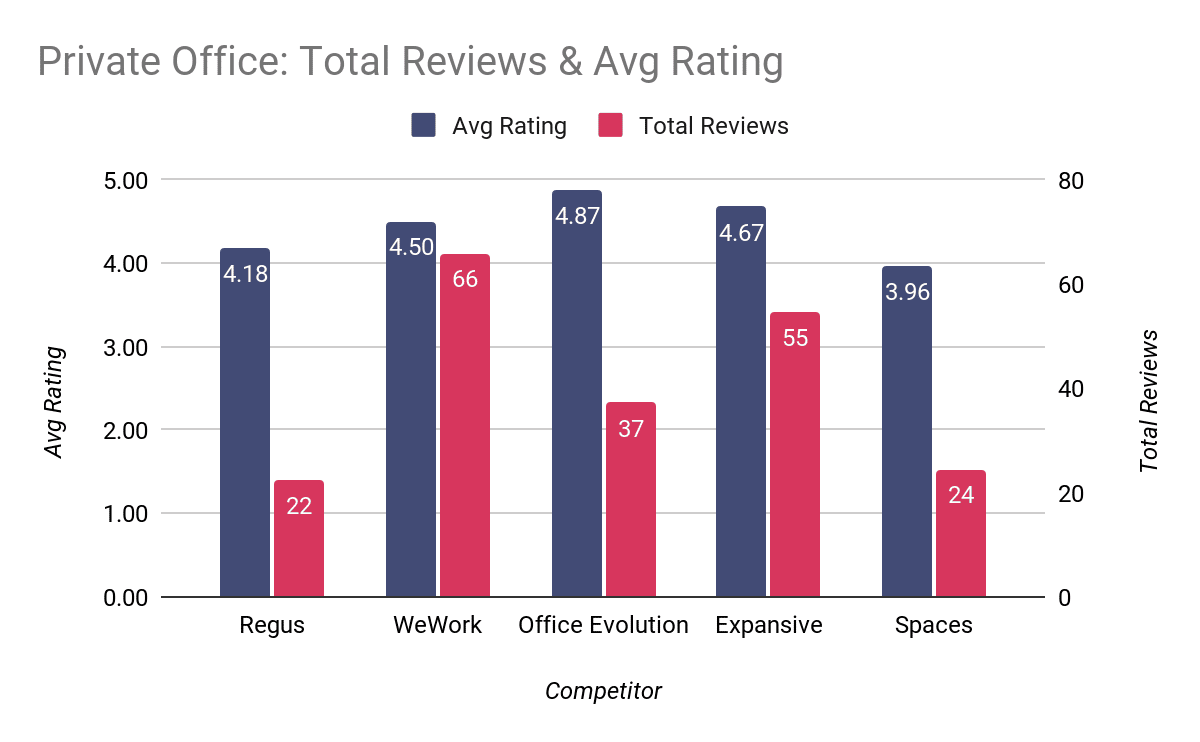
When it comes to review both in respect to total quantity and the average rating, an interesting occurrence happens specifically for the top competitor, Regus.
Though Regus itself is the most visible competitor, they are significantly lacking in generating a large amount of reviews with an average of only 22 compared to the industry wide average of 44. This can be attributed to the numerous locations that they have throughout the US. Because they are so spread out, it seems that they are unable to generate a consistent quantity of reviews for each of their locations.
However, even with the reviews that they have been generating, their scores are much closer to the industry average of 4.58.
Out of the remaining most visible private office local pack competitors, the two standouts both in terms of total reviews and average rating is WeWork, with an average of 66 reviews (well above the industry average) and a 4.50 average rating, and then Expansive with 55 reviews and a 4.67 average rating.
Place Topics
|
Topics |
Frequency |
Relevancy |
|
business |
292 |
7.19 |
|
building |
196 |
8.29 |
|
team |
190 |
5.91 |
|
amenities |
174 |
6.68 |
|
coffee |
129 |
6.13 |
|
community |
118 |
5.93 |
|
clean |
112 |
5.86 |
|
environment |
106 |
5.66 |
|
company |
88 |
5.31 |
|
price |
80 |
4.88 |
On the subject of place topics across the most visible private office local pack competitors, the amenities and atmosphere themes continue to dominate across all of the topics.
Yet again, this further proves that as a coworking space you need to be heavily investing into your amenities and atmosphere in order to set yourself apart from the competition.
Primary Categories
|
Competitor |
Coworking space |
Office space rental agency |
|
Regus |
0 |
401 |
|
WeWork |
164 |
0 |
|
Office Evolution |
0 |
138 |
|
Expansive |
113 |
13 |
|
Spaces |
0 |
104 |
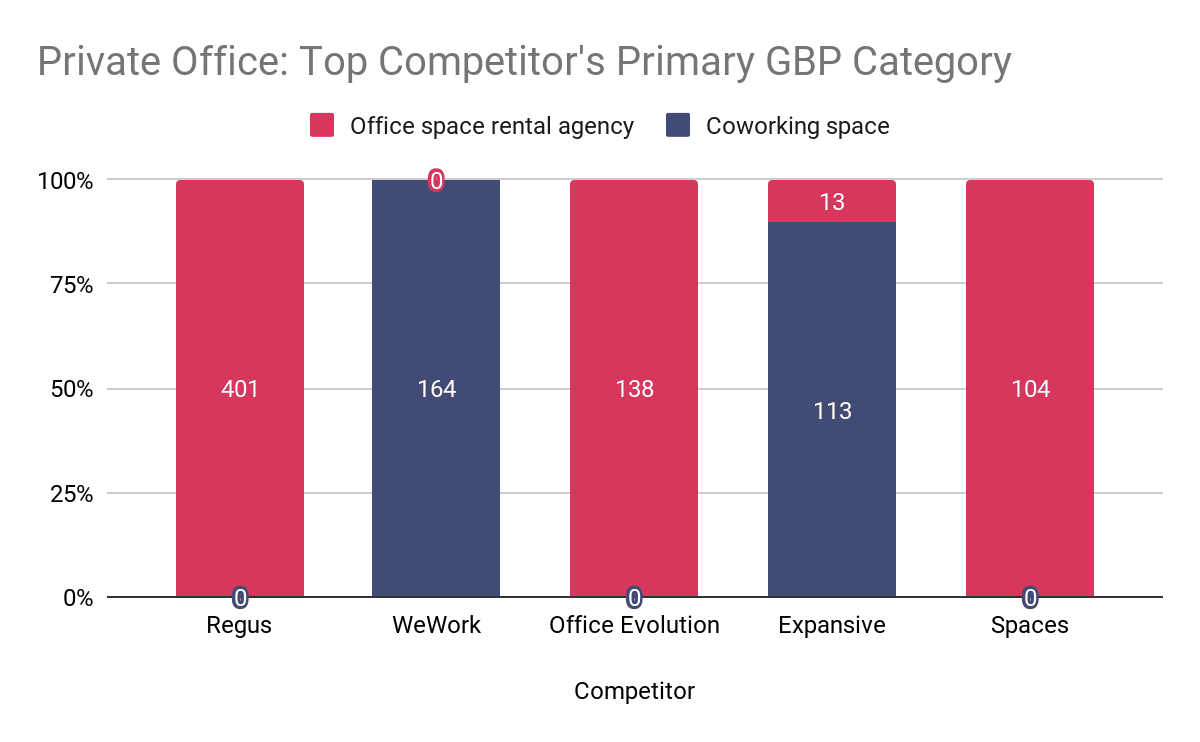
The distribution of primary GBP categories across the most visible private office local pack competitors is largely divided.
With Regus and Spaces all having “office space rental agency” as their primary category while WeWork having “coworking space” as their primary category. The black sheep in this case is Expansive where 11% of their GBP categories are listed as “office space rental agency” and the remaining 89% use “coworking spaces.”
A big takeaway here is just because you may be using “coworking space” as your primary category doesn’t mean that you will not show up for private office based keywords within the local pack.
Secondary Categories
|
Competitor |
Coworking space |
Virtual office rental |
Business center |
Office space rental agency |
Business park |
Call center |
Conference center |
Executive suite rental agency |
Mailbox rental service |
Telephone answering service |
|
Regus |
401 |
401 |
401 |
0 |
0 |
0 |
0 |
0 |
0 |
0 |
|
WeWork |
0 |
0 |
0 |
164 |
0 |
0 |
0 |
0 |
0 |
0 |
|
Office Evolution |
138 |
138 |
138 |
0 |
138 |
138 |
138 |
138 |
138 |
138 |
|
Expansive |
13 |
0 |
0 |
113 |
0 |
0 |
0 |
0 |
0 |
0 |
|
Spaces |
104 |
104 |
104 |
0 |
0 |
0 |
0 |
0 |
0 |
0 |
When it comes to secondary categories amongst the most visible office space local pack competitors, there are a few interesting takeaways.
The first is that Regus, the most visible competitor, is only using 3 (“coworking space,” “virtual office rental,” and “business center”) out of their 9 secondary category slots across all of their locations.
The second, which is also partially mentioned in the coworking space competitor analysis, is that WeWork yet again is only using a single secondary category of “office space rental agency.”
The last big takeaway is that Office Evolution is taking full advantage of all of their secondary category slots across all of their locations. Now whether or not all of the secondary categories are relevant or not (e.g. “call center”) is up for debate.
Traditional Organic
Page Speed (Core Web Vitals)
|
🗝️Key Takeaways
|
In 2018 Google announced that page speed in mobile search rankings were being introduced as a factor. Then in 2020, Google made another announcement of page experience as a ranking factor which is the usage of something called Core Web Vitals (or CWV for short).
CWV is made up of three key metrics that measure the speed and usability of a page which are:
- Largest Contentful Paint - Measures the loading performance of a page.
- First Input Delay - Measures the interactivity of a page.
- Cumulative Layout Shift - Measures the visual stability of a page.
Thankfully, Google provides us with a handy tool that measures these three factors and then aggregates the results into what they call a performance score. This is a number between 0 and 100 with 0 being the worst and 100 being the best.
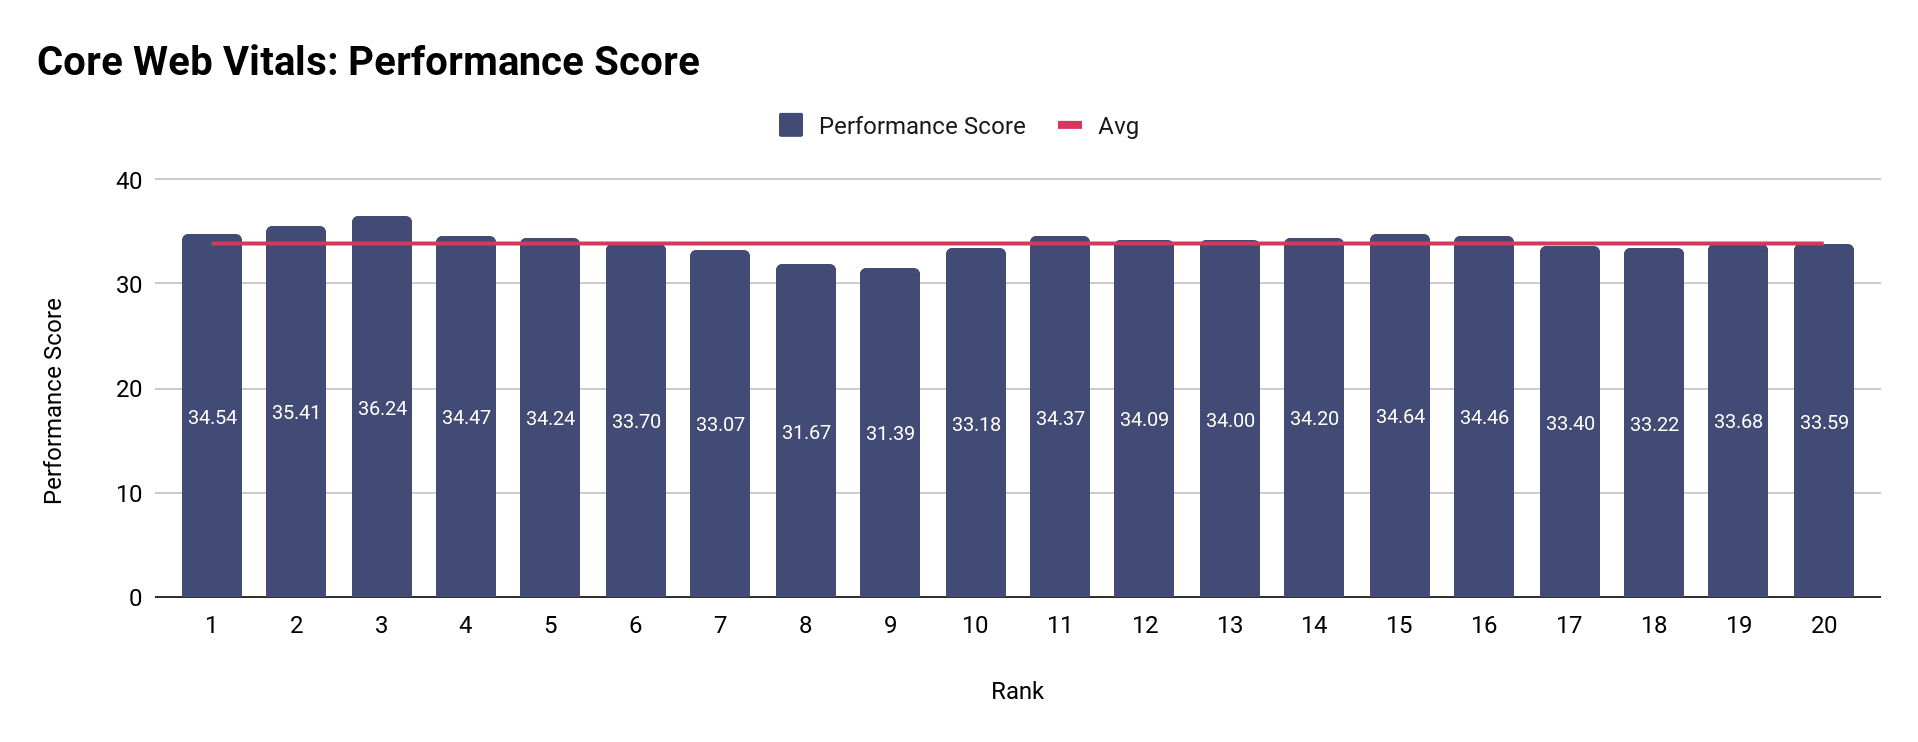
We took the top 20 pages across all of the SERPs and gathered their performance score to better understand the relationship between rankings and Core Web Vitals (CWV).
When I aggregated all of the results together, I discovered that the top 20 SERP results had:
- An average performance score of 33.9
- A medium performance score of 30.0
These results in and of itself are quite interesting in that the top 20 ranked pages across all of the keywords that I analyzed are quite low compared to what you might expect.
Diving deeper into the data, we can see an interesting phenomenon take place as we visualize the Core Web Vitals’ performance score in the chart above comparing average performance score versus rank across the top 20 organic results.
On average, the top 3 ranking websites have a significantly better performance score than the remaining positions. This is no surprise as this is something that you would expect since Google takes this into consideration when ranking websites.
What I find quite interesting is that as you look at results 4 through 10, which is the rest of the page 1 results, there is a clear dip in performance score. Then as you move to the Page 2 (rank 11 through 20), you see an increase and then flattening of the performance score to the point where there are Page 2 results (rank 11 through 2) that score higher than certain Page 1 results (rank 7 through 10).
When I further segmented the performance scores by coworking and private office keywords, I noticed the same trends across both average and median scores.
This shows us that even though you have a high Core Web Vitals performance score it doesn’t mean you’re guaranteed to be on Page 1 and that there are other factors that have a heavier weight on rankings.
Backlinks
|
🗝️Key Takeaways
|
If you’ve heard or read anything about SEO then you’ve probably heard of backlinks and link building. Unfortunately, there is a LOT of misinformation out there, whether it is just plain old lies or out of date recommendations. Hopefully some of the insights below will help give you a better understanding of what to do and not to do.
Linking Root Domains
Linking root domains is, as the name suggests, the total number of unique linking domains (websites) that are pointing to a specific page or URL. This is different from backlinks as a single domain can have multiple links pointing back to the same URL.
For example, if New York Times has two articles published and each of the articles have a link pointing to your space’s website then that would count as two backlinks and a single linking root domain. This is because you have two separate backlinks coming from a single domain.
The reason why linking root domains is important is that Google sees diversity of a site’s backlinks as an important factor. Meaning the more diversity (more linking root domains) that you have the better.
Coworking Linking Root Domains
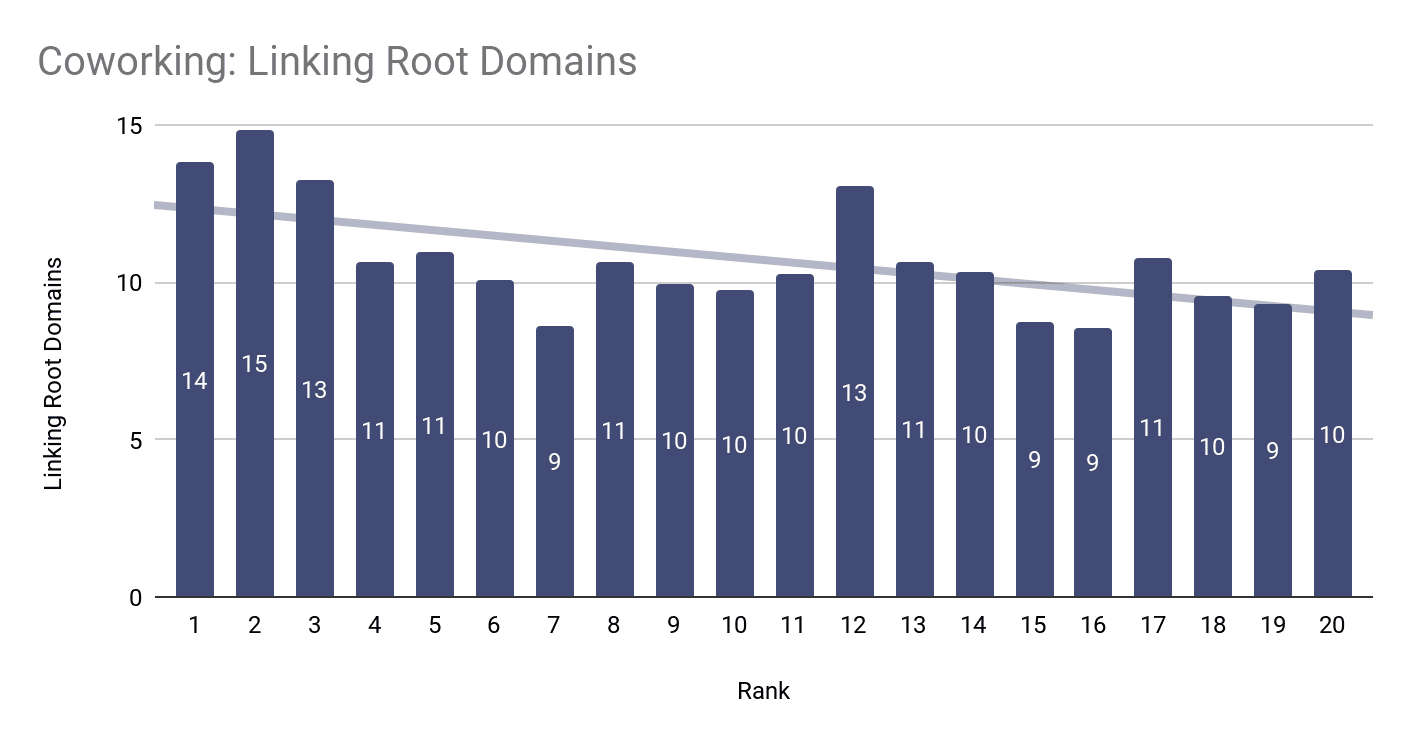
As I can see in the above chart, the top 3 ranking sites for “coworking” related keywords have a much higher count of linking root domains (14, 15, and 13) compared to the remaining 20 positions (average of 11).
The relationship between rankings and linking root domains can be seen even clearer when looking at the trendline in the above chart. Showing as rank increases the number of linking root domains decreases which is expected.
Private Office Linking Root Domains
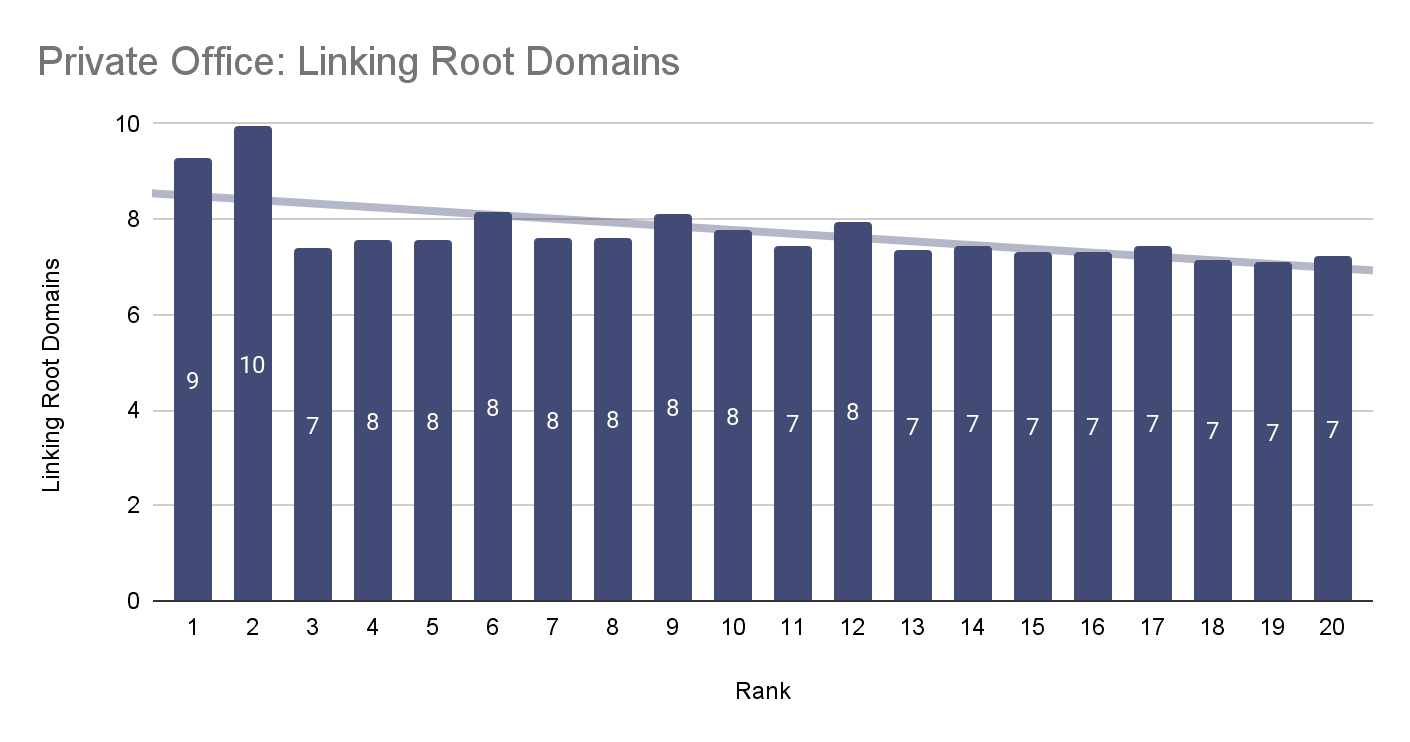
When it comes to “private office” keywords, we can see in this case the top 2 ranking URLs on average have the highest number of linking root domains (9 and 10) and then a sharp drop off from rank 3 to 20 with an average of 8 linking root domains.
This illustrates a major opportunity for coworking spaces to quickly rise above the competition by building quality and relevant links to their private office product pages.
Domain Rating
Domain Rating, or Domain Authority, is probably another term that you hear quite often when it comes to SEO and backlinks. For those who don’t know, Domain Rating is a proprietary metric calculated by Ahrefs (not Google) on how authoritative a domain is on a scale of 0 to 100. Where 0 is not authoritative at all and 100 is extremely authoritative (think Wikipedia and YouTube).
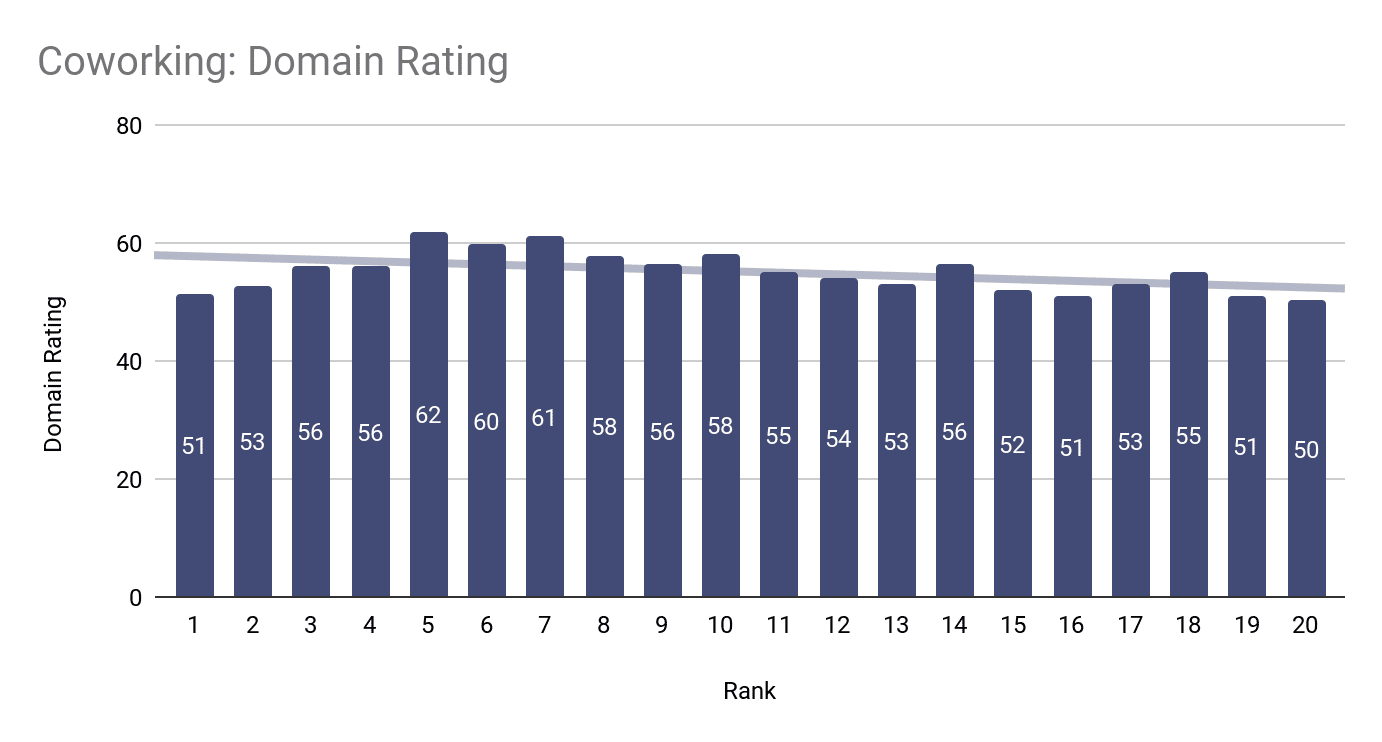
Coworking
Intuitively you would expect that the higher the Domain Rating the better the ranking. However, as shown in the above chart for “coworking” keywords, that is not necessarily the case. We can clearly see that on average positions 1 through 3 (51, 53, and 56) have a relatively lower Domain Rating than positions 4 through 8 (56, 62, 60, 61, and 58).
What this illustrates is that it isn’t always the most authoritative (high Domain Rating) websites that rank the best. What I discovered as I dug deeper is that contextual relevance (in this case location) played a much greater role. Meaning that on average a coworking space’s homepage with a lower Domain Rating ranked better than an aggregator website’s (e.g. Coworker.com or Desk Pass) sub page with a high domain authority.
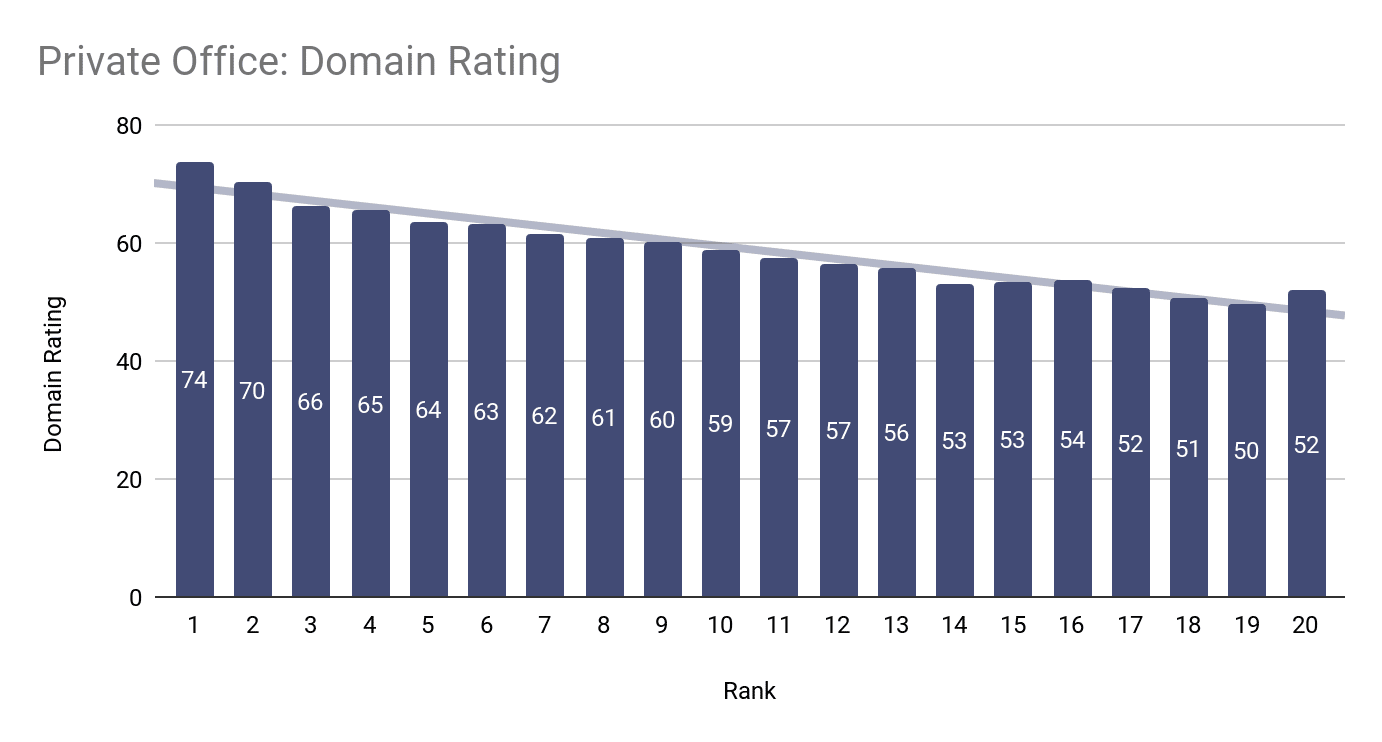
Private Office
The “private office” keywords on the other hand show a much different story when it comes to Domain Rating and rankings.
In the above chart, we can clearly see that there is a clear relationship between a higher Domain Rating and better rankings. Since subpages dominate the rankings for “private office” keywords, Domain Rating has a closer relationship with ranking well.
Word Count
|
🗝️Key Takeaways
|
You may have read or heard somewhere that the total number of words on a page matters when it comes to rankings in search engines. To help shed more light on this subject, I analyzed word count across the top 20 results on the SERP.
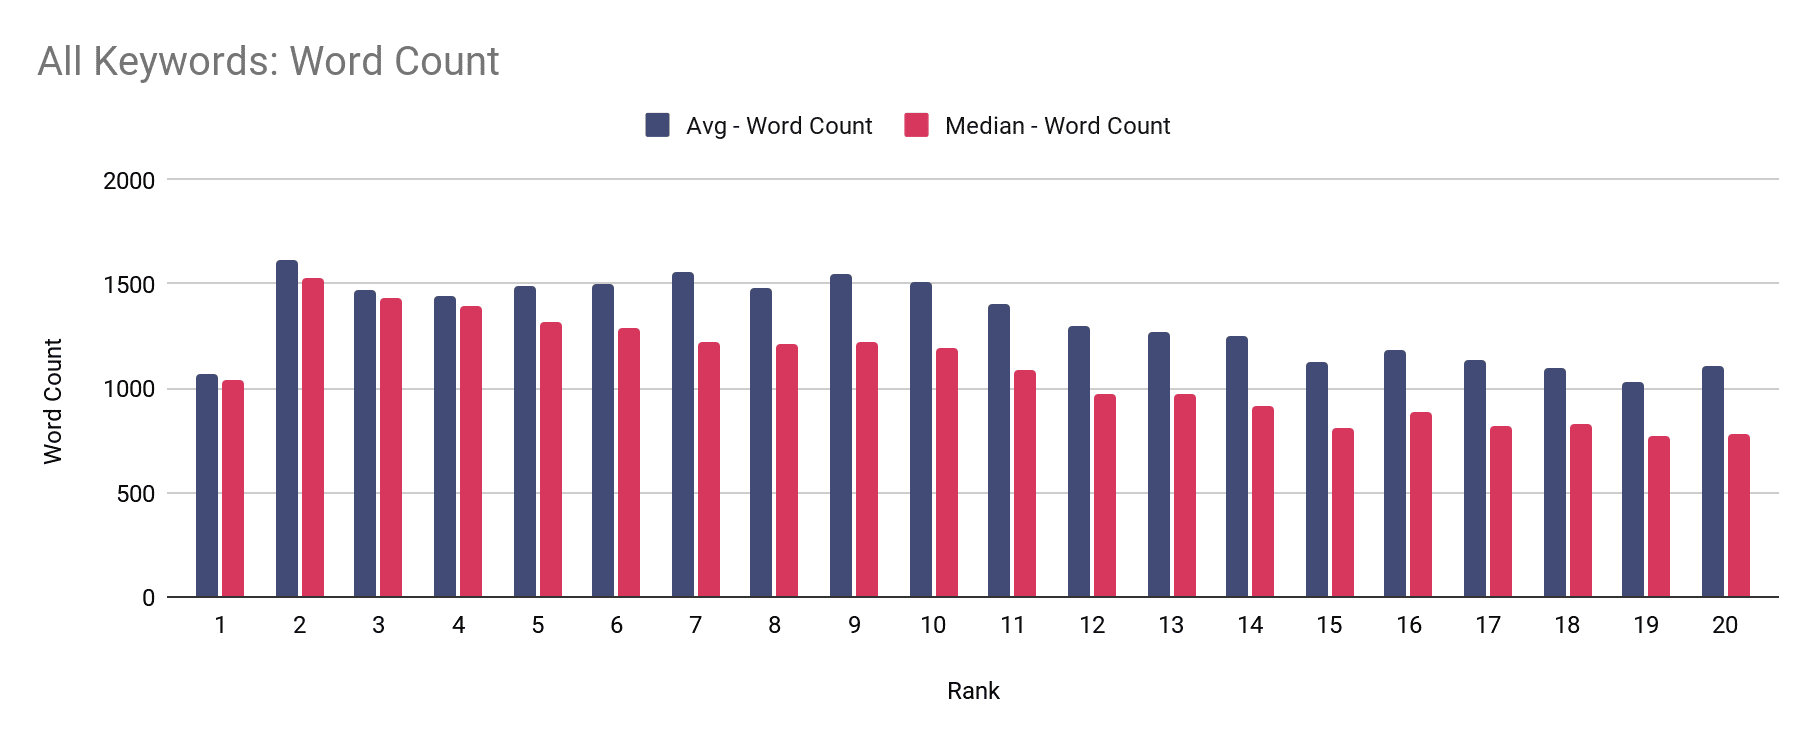
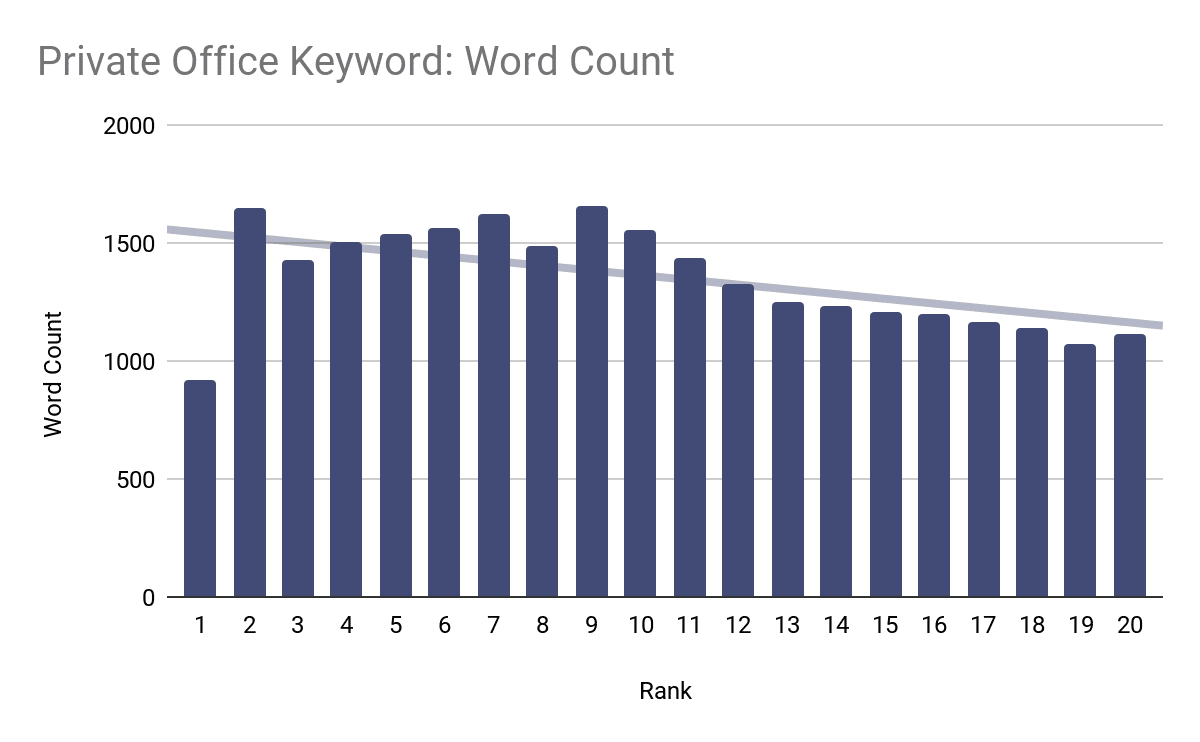
As seen in the above graph, the word count distribution across the top 20 rankings is quite interesting when looking at both the average and the median.
When looking at the top three results (rank 1 through 3) , the first page across both the average and the median has a relatively low count of (1071 on average and 1036 on median). While the second result (rank 2) has a significantly higher number of words with 1617 on average 1525 as a median.
Then from rank 3 through 20, you see a clear decline in the average and median number of words on each page.
The last interesting takeaway is the clear gap between the average and median word count across all of the ranks. What this means for us is that there are a handful of websites that are throwing off the overall average across each rank.
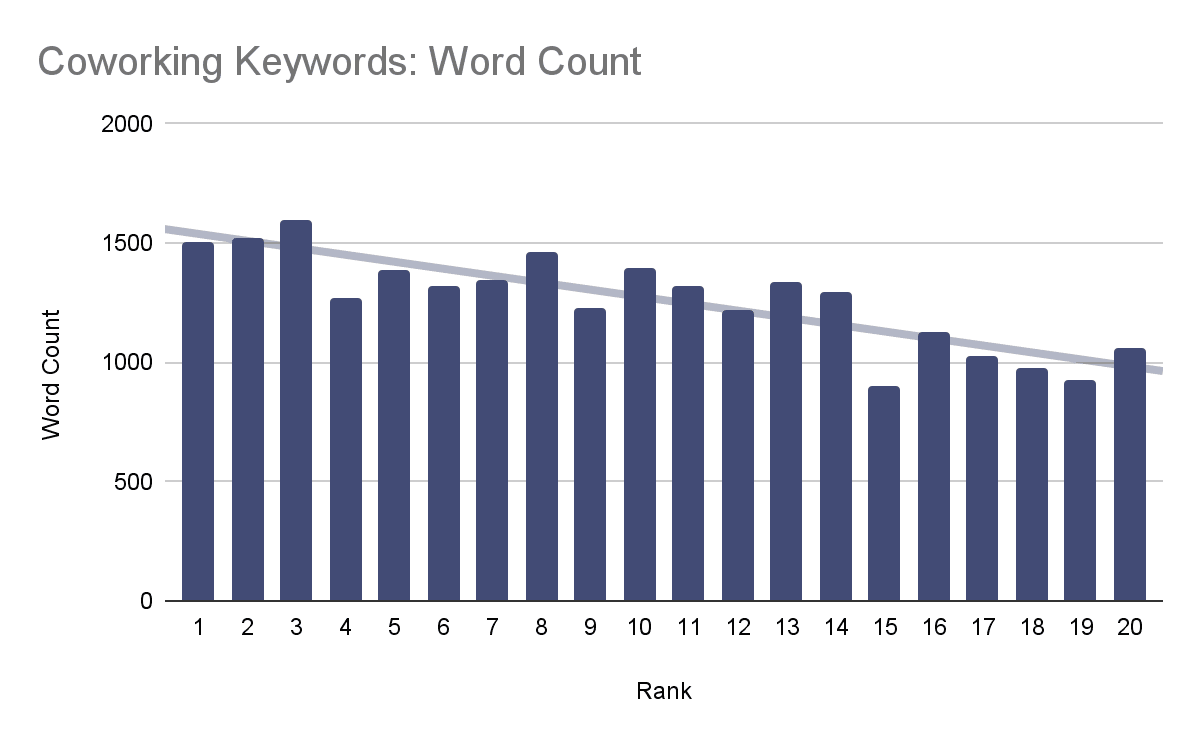
Coworking
As I investigated more into understanding the word count jump from rank 1 and rank 2, a new finding occurred when I segmented the results into “coworking” and “private office” buckets.
As we can see in the above chart, the word count distribution across rankings for "coworking” based keywords is much different from the previous chart of all of the keywords. In this case, the pages in rank 1 have a significantly larger word account of 1505 compared to the aggregated average of 1071 words.
There is then a significantly sharp drop in word count from ranks 3 to 4 and then a gradual decline in overall word count average.
Private Office
When we switch over to the “private office” themed keywords, this is where we can see the cause of the low word count for rank 1 pages versus rank 2 and rank 3 pages. This low word count is due to aggregation sites, specifically Loopnet and Yelp, ranking in the 1st position and appearing many times throughout the SERPs that I analyzed.
Home vs Sub Page
|
🗝️Key Takeaways
|
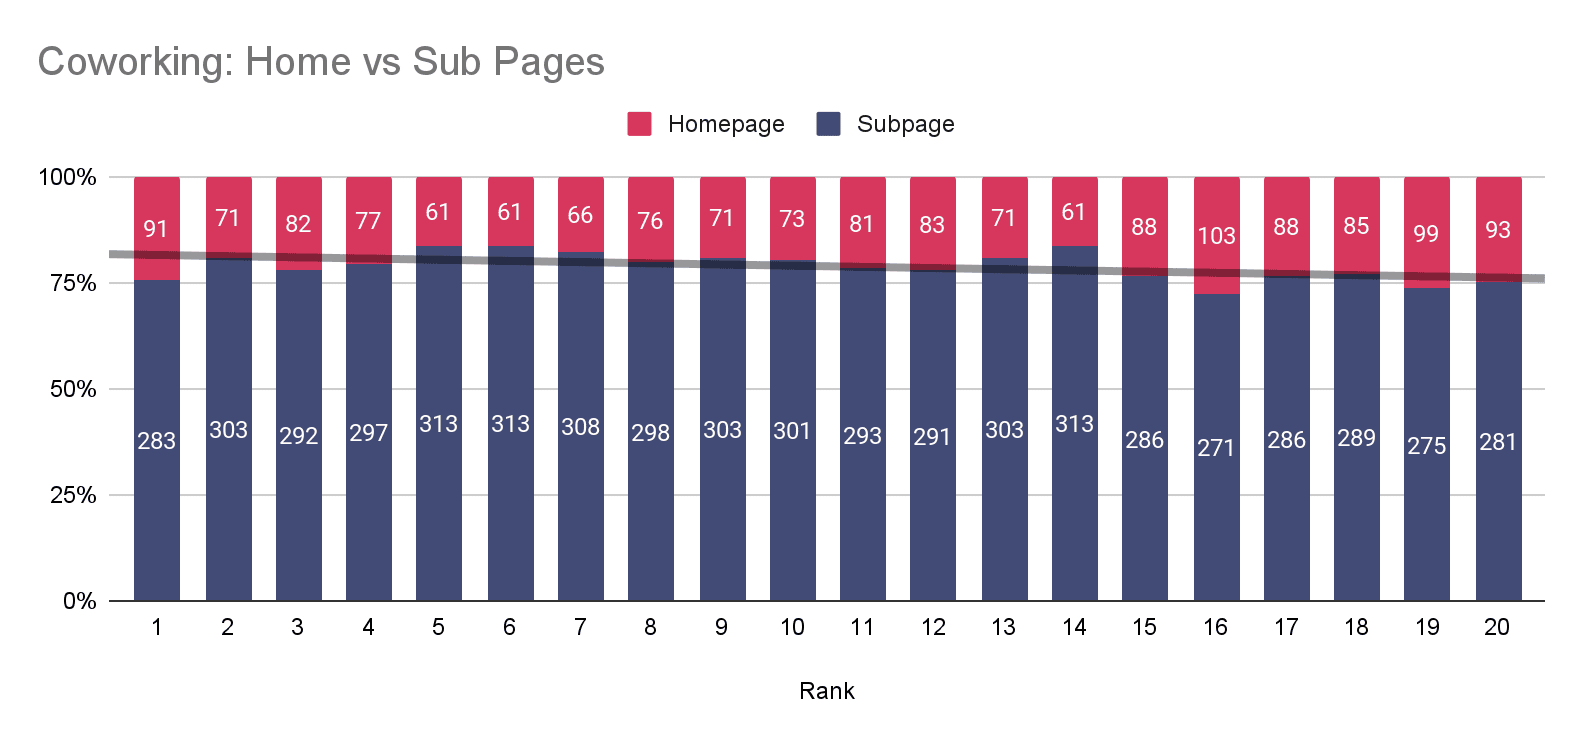
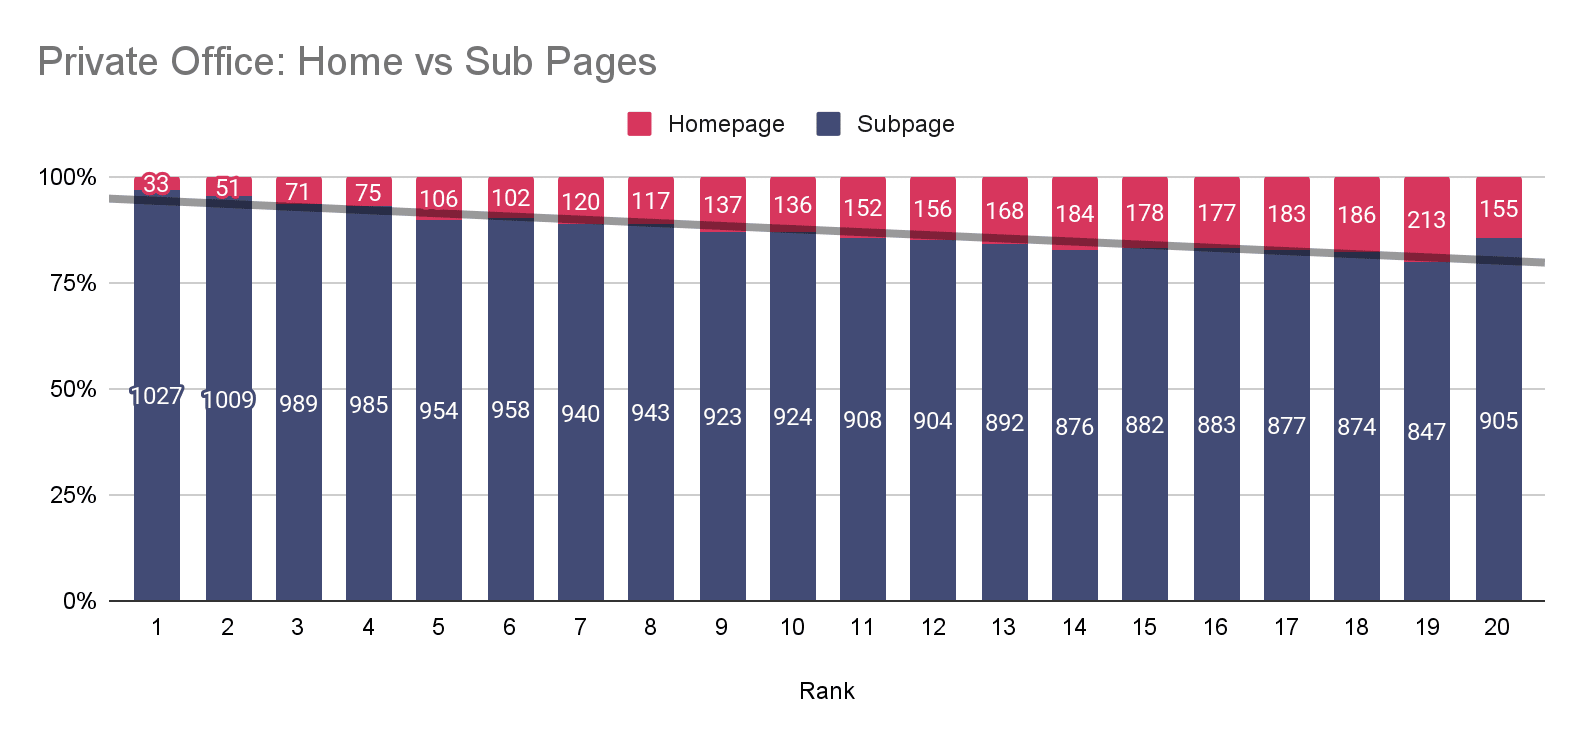
Similar to the analysis conducted on the Google Business Profile pages, I wanted to understand the distribution of home and sub pages versus rankings. To gain more meaningful insights, I again segmented the results into “coworking” and “private office” keyword groups.
Coworking Keywords
Similar to the findings in the Google Business Profile home vs sub page analysis, the majority of results across the top 20 results are made up of sub pages rather than homepages. However, as we can see in the transparent black trend line, there is a slight decrease in subpages as a total percentage as you move from rank 1 to rank 20.
Private Office Keywords
Nearly identical to the “private office” keyword group in the GBP analysis, we can see that the majority of top ranked pages are using a subpage rather than a home page to rank for “private office” keywords. Furthermore, we can see that as rank increases from 1 to 20 that homepages become more visible albeit still small as an overall percentage.
Top Domains
Now that we have an understanding of what the overall industry looks like, let’s dive into gaining more insight into what the top websites are doing across both “coworking” and “private office” keywords.
Coworking
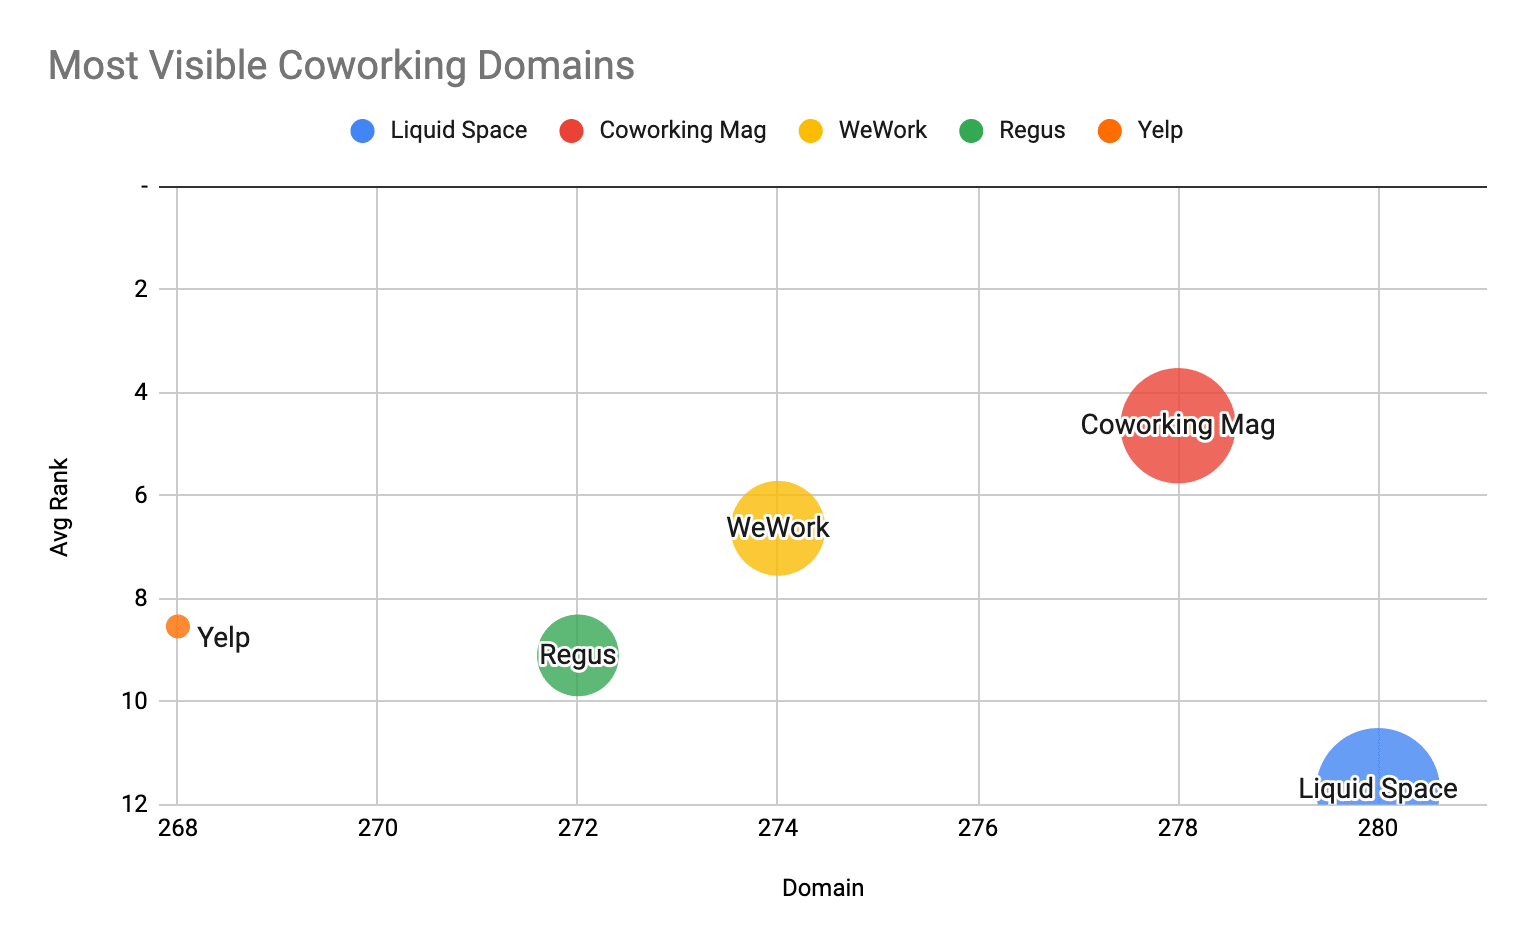
When looking at “coworking” related keywords, the top 5 most visible domains (based on the number of times that they appear) are:
|
Domain |
Frequency |
Avg Rank |
|
Liquid Space |
280 |
11.72 |
|
Coworking Mag |
278 |
4.64 |
|
WeWork |
274 |
6.64 |
|
Regus |
272 |
9.10 |
|
Yelp |
268 |
8.54 |
Based on the competitors listed above, a couple of interesting takeaways.
This first interesting insight is the appearance of Coworking Mag, which is primarily known as an industry publication. What may not be known is they have a fairly comprehensive coworking space directory which has ended up ranking for a significant amount of keywords.
Another interesting competitor is the appearance of Yelp. Though it is a very well known directory, it is not a coworking industry specific site. I would have expected other aggregators that are coworking space specific (e.g. Coworker, or Drop-Desk) to be more visible than Yelp.
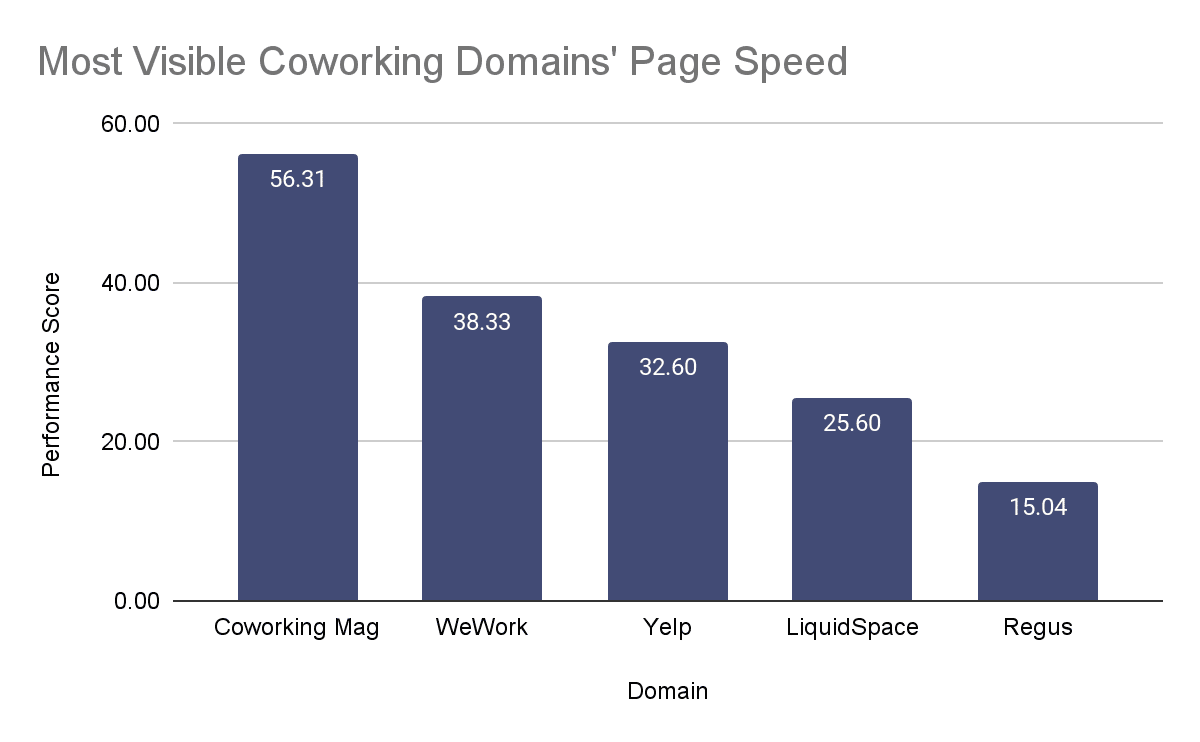
Page Speed (CWV)
When it comes to the loading speed of the most visible domains, there are a few takeaways based on the above results.
The first is that it is no surprise that Coworking Mag has the highest performance score since the pages that are ranking are articles rather than location or internal search pages (pages that lists multiple coworking spaces).
Out of the remaining most visible domains, only WeWork sits above the industry average of 33.9 with an average performance score of 38.33.
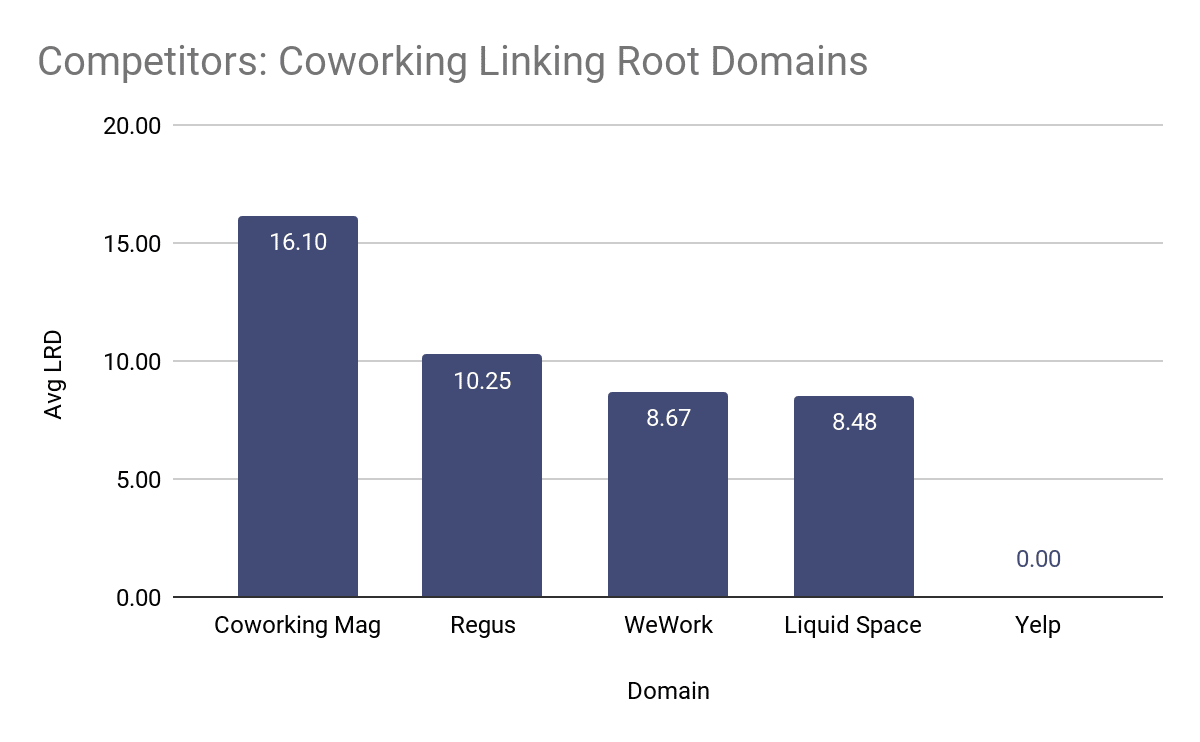
Backlinks - Linking Root Domains
As shown in the above chart, the amount of linking root domains across each of the most visible “coworking” keyword competitors vary greatly and also provides two surprising takeaways.
The first is that Coworking Mag has, on average, 16 linking root domains to each of the pages ranking for “coworking” keywords. This helps provide a clear indication of why they are ranking so well and one of the most visible competitors. In fact, Coworking Mag has a higher average (of 16.10) when compared to the rest of the industry (of 11.25).
One, quite shocking, insight from the chart above is that every single one of Yelp’s pages that are ranking for any “coworking” keyword has no linking root domains. Which means that from a backlink perspective, Yelp is being “propped up” by all of the other domains linking to it and overall website authority.
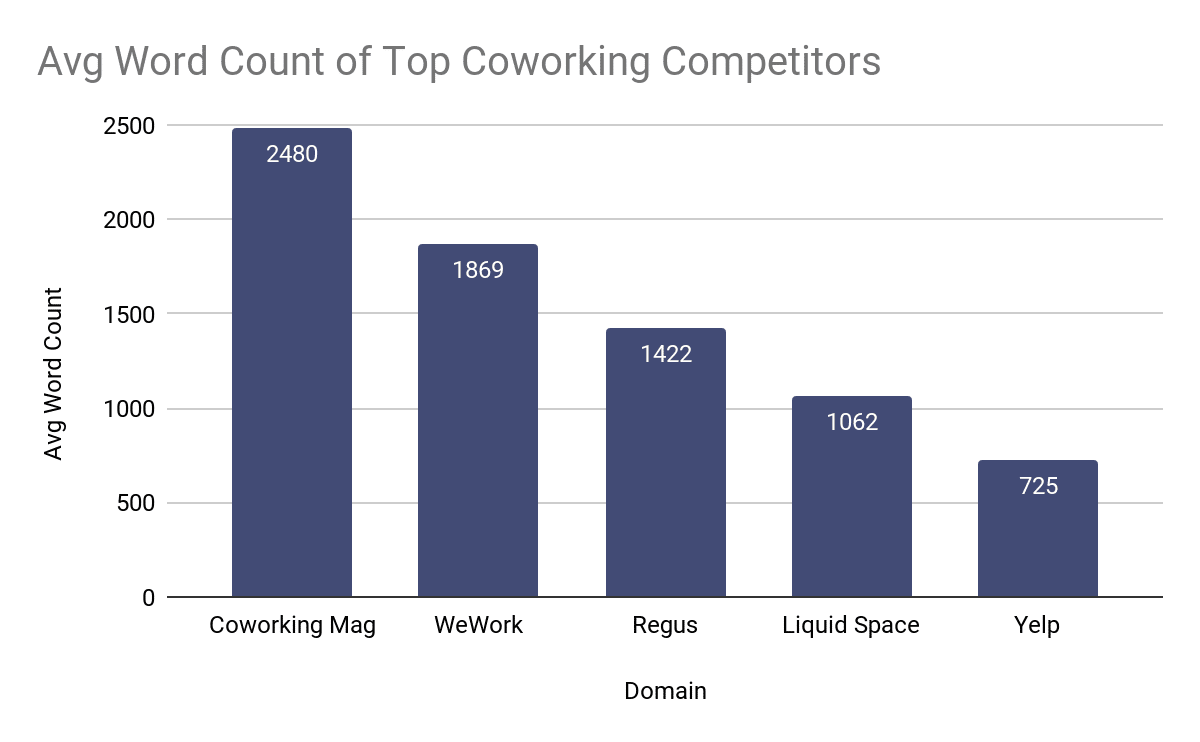
Word Count
When looking at average word count, the ordering of most visible competitors is exactly the same as the linking root domain with Coworking Mag first, followed by Wework and then Regus along with Liquid Space and then lastly Yelp.
Yet again, Coworking Mag is an outlier with an average of 2490 words per ranking page compared to the 1071 industry average. When diving deeper into this, it is no surprise since the pages that are ranking are actually in a blog post format which significantly inflates their average word count.
In second place by word count is WeWork, which is well above the industry average word count of 1071 and is sitting at 1869 average words. This is particularly interesting since the pages that WeWork is a mixture of blog posts, building pages, and city pages. This goes to show that it isn’t necessarily a single type of page (e.g. city pages) that will rank best, but it can be a mixture of different types.
The other competitor that should be called out is Yelp, which has by far the lowest average word count of 725 and is below the industry average of 1071. If we start to look at some of the pages that Yelp is ranking with, it is no surprise as they are all strictly city search pages.
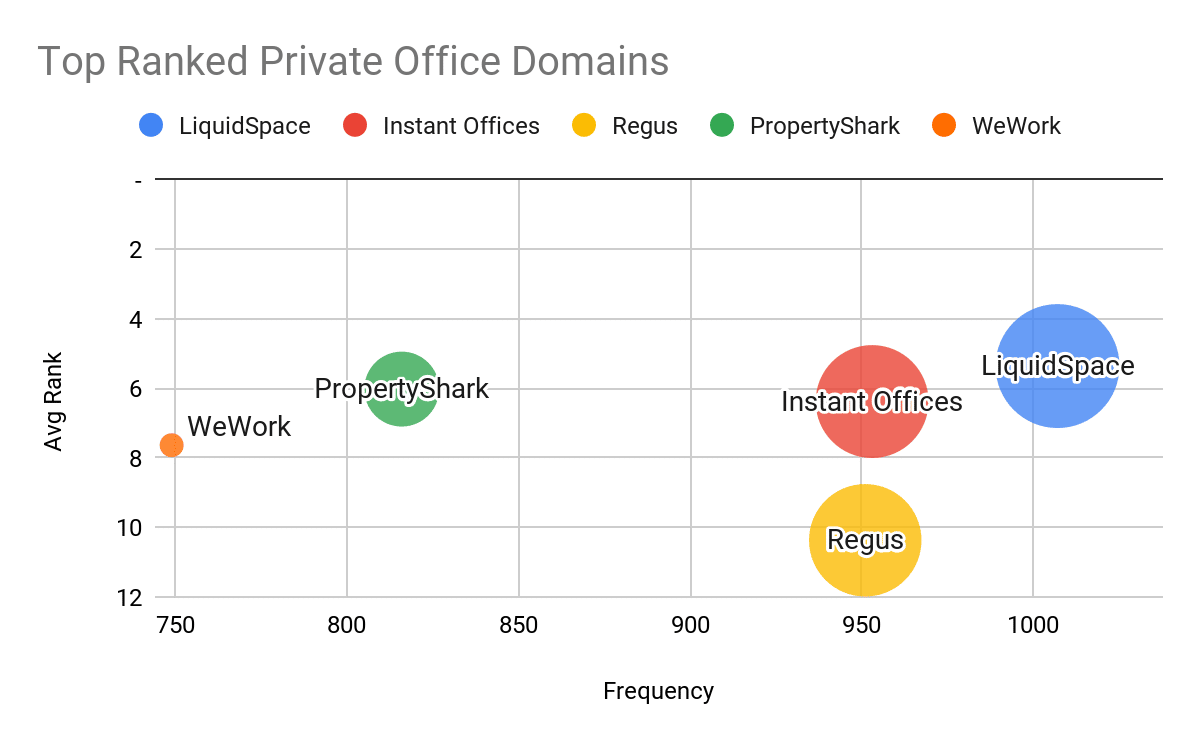
Private Offices
|
Domain |
Frequency |
Avg Rank |
|
LiquidSpace |
1007 |
5.36 |
|
Instant Offices |
953 |
6.38 |
|
Regus |
951 |
10.37 |
|
PropertyShark |
816 |
6.02 |
|
WeWork |
749 |
7.64 |
With regards to “private office” keywords, the most visible domains can be found in the table and chart above. To no one’s surprise, aggregators (LiquidSpace, Instant Offices, and Property Shark) make up the lion’s share of the most visible domains since they are most likely to be ranking in each city.
Following the aggregators, you have private office suppliers which are Regus and WeWork. Yet again, this is not a surprise given how many locations each of these companies have throughout the US.
Page Speed (CWV)
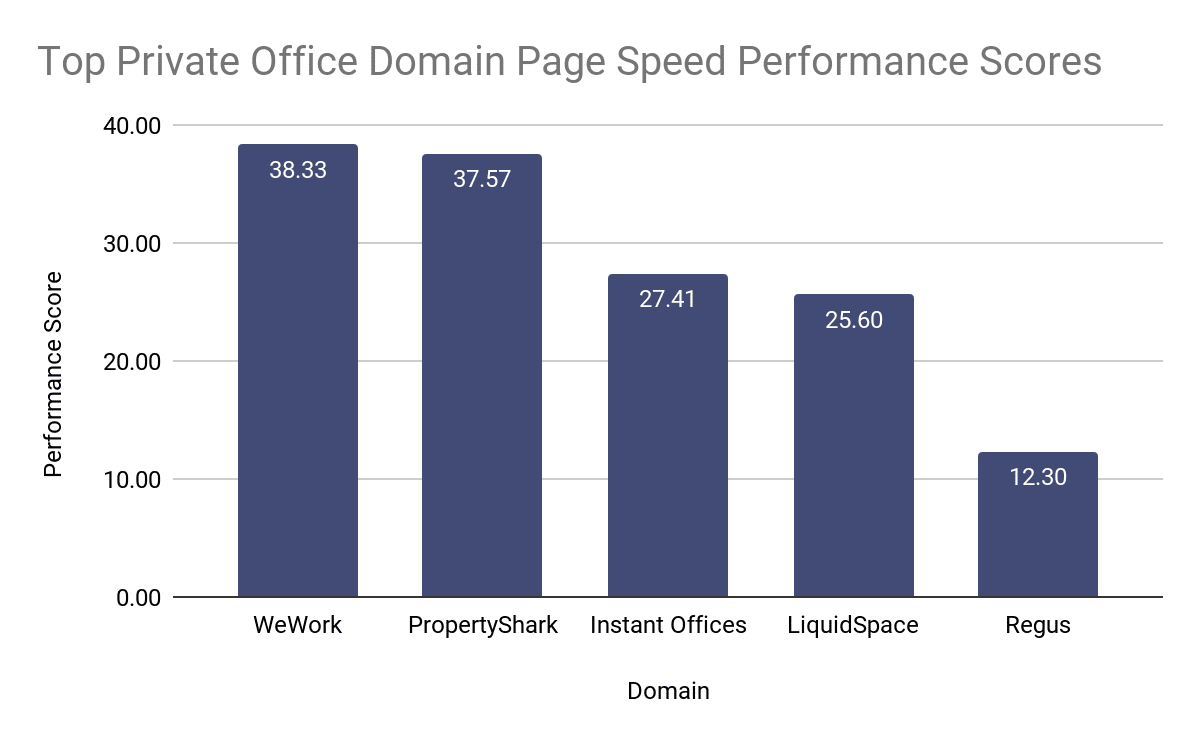
When it comes to page speed, the most visible domains had performance scores across the board. WeWork and PropertyShark both have significantly higher performance scores of 38.33 and 37.77 above the industry average of 33.9.
While Instant Offices (27.41), LiquidSpace (25.60), and Regus (12.30) all scored below the overall industry average (33.90).
Similar to the findings in the overall industry analysis section, the page speed (performance score) is one of the factors that should be improved but not obsessed over, since you can rank well in search engines without having a stellar loading speed.
Backlinks - Linking Root Domains
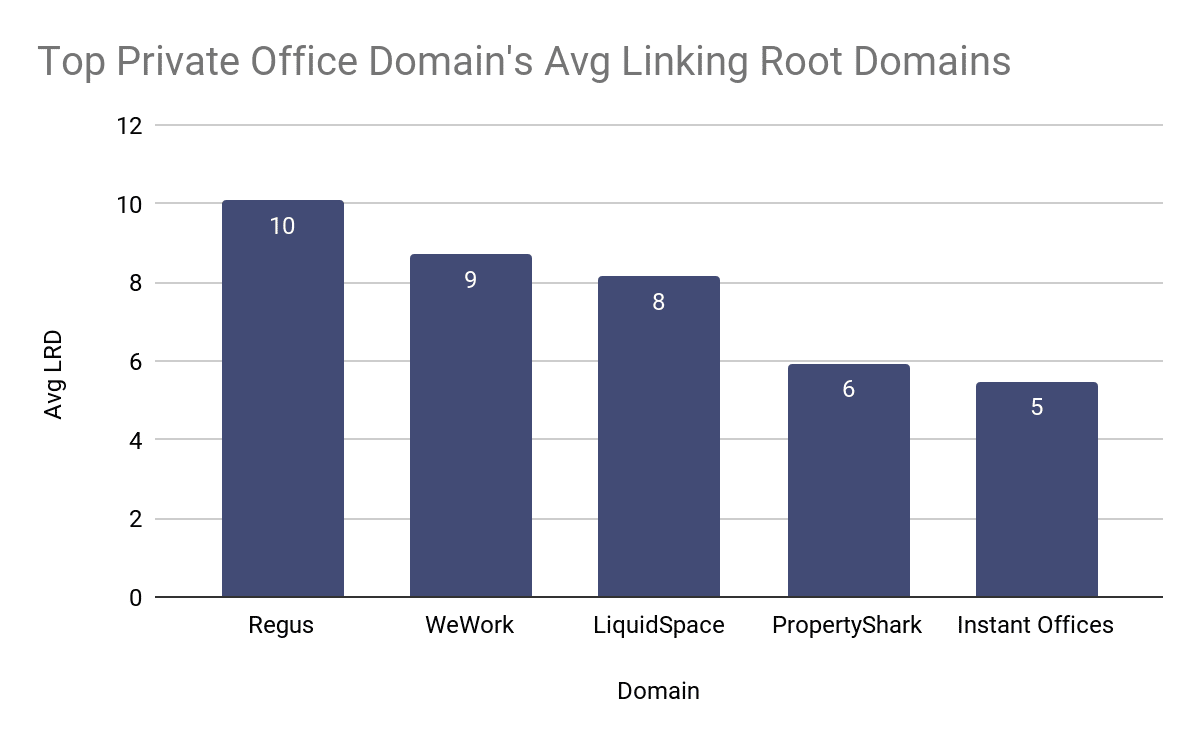
Looking into the average amount of linking root domains that each of the most frequent “private office” domains has shows an interesting story of who is actively investing into SEO and link building efforts.
Regus is clearly the stand out with an average of 10.07 unique domains linking to their pages, which is above the industry average of 8.
Then comes WeWork and LiquidSpace, with both matching the overall industry average of 8. Then finally comes PropertyShark and Instant Offices with an average of 6 which is noticeably lower than the overall industry average.
These numbers give us insight into an opportunity that should be taken advantage of. The majority of the top domains are well within competitive reach when it comes to linking root domains for a private office provider of any size.
Word Count
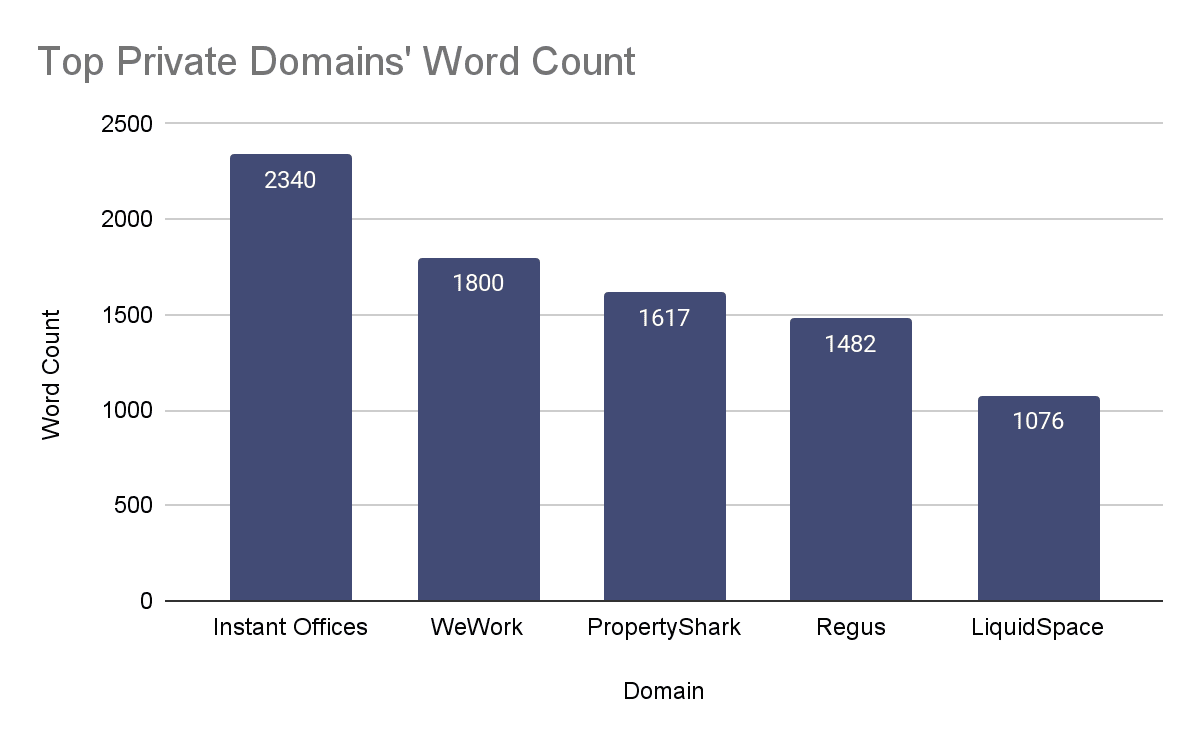
Analyzing the word count of the most visible domains’ for “private office” related keywords as shown in the above chart shows a few takeaways.
The first and most apparent takeaway is that all of the top domains, aside from LiquidSpace, have a higher average word count than the industry’s average of 1353 words per page. Though this is no surprise since there is a strong correlation between an increased word count and higher rankings.
Another interesting takeaway is the word count gap between Instant Offices, with an average of 2340, versus the closest domain, which in this case is WeWork at an average of 1800. This translates into a 540 average word gap.
Summary & Takeaways
To summarize, whether you are a coworking space or private office provider that is just launched or open for years, SEO is a powerful channel that can and should be taken advantage of. It isn’t something where spaces with numerous locations and enormous budgets dominate. In reality, there is still fragmentation and opportunity for a single location space to drive meaningful business.
Local Pack
As a coworking space, having a Google Business Profile (GBP) is an absolute must and can be seen as simply an entry fee into being able to compete within the local pack.
Once you have your space’s GBP profile verified be sure to:
- Get a minimum of 44 reviews as quickly as possible, and then continue to earn them consistently throughout each month to stay ahead of the competition.
- Don’t be afraid of negative reviews, and do respond to them in a positive customer centric manner.
- Choose the right primary category:
- If you’re a coworking space looking to generate more members for private offices then use “office space rental agency” as your primary category.
- If you’re looking to drive more coworking space type members (dedicated desk, hot desks, etc…) then use “coworking space” as your primary category.
- Take advantage of all of the secondary categories that GBP has to offer by:
- Assuming your coworking space offers it, make sure that you’re using “office space rental agency” as a secondary category if you aren’t already using it as a secondary one and vice versa.
- Where applicable, use as many of the 9 secondary categories as possible to help improve your chances of appearing for secondary product related searches (e.g. meeting rooms or virtual offices).
- Use the correct primary URL on your GPB profile where:
- If you’re a single location space, your primary GBP link should be going to your home page and you need to be actively investing in your GBP efforts.
- If you’re a multi-location space, your primary GBP links should be going to a dedicated page for that location.
If you follow the above takeaways, you’ll be well on your way to dominating the local pack.
Traditional Organic
When it comes to the traditional organic results, things do become a bit trickier as you’re now competing with aggregators such as Loopnet, LiquidSpace, and Instant Office to name a few. That, however, shouldn’t discourage you, as there is still opportunity to thrive within traditional organic results.
For a coworking space to do well in traditional results, they should:
- Invest time into improving your site’s loading speed, but don’t obsess over it since it isn’t the heaviest weighted search engine factor.
- Spend time earning high-quality and contextually relevant links from websites aiming for 9 to 14 links to the page you want ranking for “coworking” or “private office” keywords.
- Aim for 1500 words per page, but the important part is to make sure the content on these pages is unique and valuable to both search engines and potential members.
- If you’re a single location coworking space, your home page should target coworking keywords along with having a private office service page
- If you’re a multi-location coworking space, you should have a page for each location along with a dedicated private office and coworking service page.
Feeling overwhelmed and wanting help?
If you’re feeling overwhelmed and not sure where to start, never fear! Feel free to reach out to me by scheduling a strategy session where I’ll walk you through how to get started and the biggest levers that you can pull to start seeing results.
